


Understanding the Meaning of 30% OTE and Its Importance in Sales
What does 30% OTE mean? When it comes to sales, one term that often comes up is “30% OTE”. But what does it mean? And why is it important? OTЕ stands …
Read Article
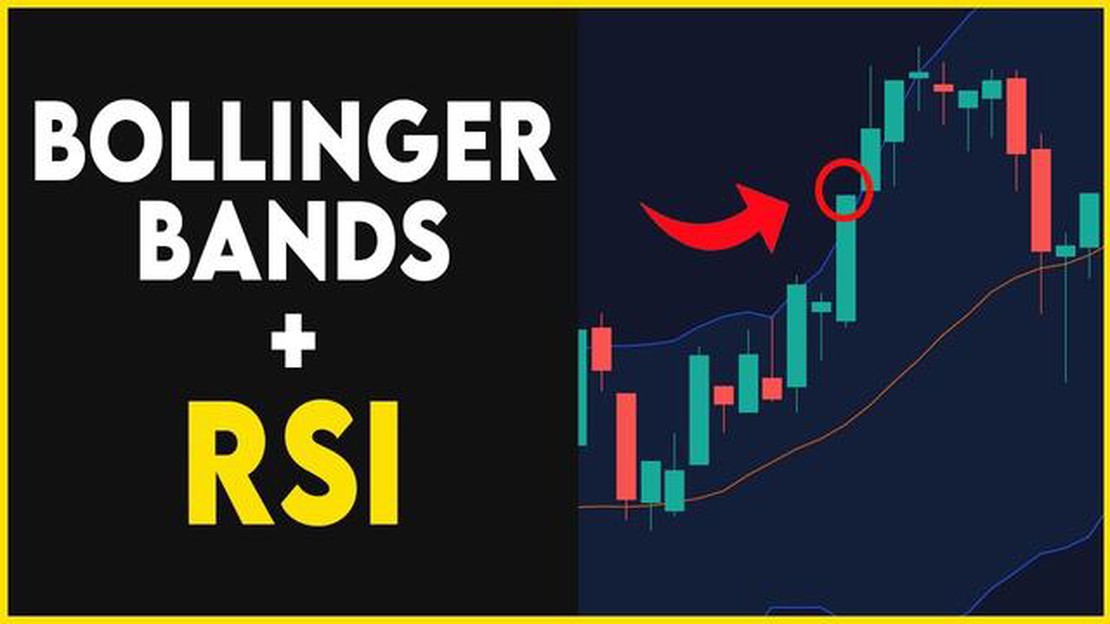
The Bollinger Band is a popular technical analysis tool used by many day traders. It consists of a simple moving average line, an upper band, and a lower band. The main idea behind the Bollinger Band is that the price of an asset tends to stay within the upper and lower bands most of the time. This tool is primarily used to determine the volatility and potential price reversals.
One of the key benefits of using the Bollinger Band in day trading is its ability to provide valuable information about market conditions. By analyzing the position of the price in relation to the bands, traders can identify overbought or oversold conditions and possible trend reversals. This can be helpful in making informed trading decisions and maximizing profits.
However, like any other technical analysis tool, the Bollinger Band has its drawbacks. One of the main criticisms is its reliance on historical data. Since it uses a moving average line and bands based on standard deviation, it may not always accurately reflect the current market conditions. Market dynamics can change rapidly, and the Bollinger Band may not adjust quickly enough to capture these changes.
Another potential limitation of the Bollinger Band is its subjective nature. Traders have different interpretations of the bands, leading to varying trading strategies. Some traders may consider a price touching the upper band as a sell signal, while others may see it as a potential breakout signal. This subjectivity can lead to inconsistent trading results and confusion.
In conclusion, while the Bollinger Band can be a useful tool in day trading, it is not without its limitations. Traders should be aware of its strengths and weaknesses and use it in conjunction with other indicators and analysis techniques. Ultimately, successful day trading relies on a comprehensive understanding of the market and a disciplined trading approach.

The Bollinger Band is a technical analysis tool that consists of a moving average line and two standard deviation lines. It is commonly used by day traders to analyze the volatility and potential price movements of a security. However, whether it is effective for day trading or not depends on various factors.
One of the main advantages of using Bollinger Bands for day trading is that it helps traders identify periods of high volatility and potential price reversals. The upper and lower bands can act as support and resistance levels, indicating when a security is overbought or oversold. This can be useful for making trading decisions and setting stop-loss levels.
Another benefit of Bollinger Bands is that they can provide traders with a visual representation of price volatility. The width of the bands expands during periods of high volatility and contracts during periods of low volatility. This can help traders determine the optimal time to enter or exit a trade.
However, there are also some limitations to using Bollinger Bands for day trading. One of the downside is that it is a lagging indicator, meaning it provides information about past price movements. It cannot predict future price movements with certainty. Therefore, it is important for traders to use other technical indicators and analysis tools to confirm any signals provided by the Bollinger Bands.
Additionally, Bollinger Bands may not be effective in all market conditions. They work best in trending markets where price movements are clear and consistent. In sideways or choppy markets, the bands may generate false signals and result in losses for traders.
In conclusion, while Bollinger Bands can be a useful tool for day trading, they should not be used in isolation. Traders should consider other technical indicators, market conditions, and their own risk tolerance when making trading decisions. It is important to conduct thorough analysis and practice proper risk management to mitigate potential losses.
Read Also: Find out the promo code for Icici Bank money transfer to World and save today!
Like any trading indicator, Bollinger Bands come with their own set of pros and cons. Understanding these can help you make an informed decision on whether to include Bollinger Bands in your day trading strategy:
| Pros | Cons |
|---|---|
| **1. Clear visual representation:**Bollinger Bands provide a clear visual representation of price volatility and potential trading opportunities. The bands expand and contract based on market conditions, allowing traders to easily identify periods of high and low volatility. | **1. Lagging indicator:**One major drawback of Bollinger Bands is that they are a lagging indicator. They are based on historical price data, which means they may not reflect the most up-to-date market conditions. This can lead to delayed or inaccurate signals. |
| **2. Versatile:**Bollinger Bands can be used in various trading strategies and timeframes. They can help identify potential trend reversals, overbought and oversold conditions, and price breakouts. | **2. False signals:**Like any indicator, Bollinger Bands are not foolproof and can generate false signals. Traders must exercise caution and use additional analysis and confirmation techniques to validate signals before entering trades. |
| **3. Provides support and resistance levels:**Bollinger Bands can act as dynamic support and resistance levels. The middle band often serves as a support or resistance level, while the outer bands can indicate potential reversal points. | **3. Subject to sideways markets:**In choppy or ranging markets, Bollinger Bands can produce false signals or fail to provide clear indications. Traders must be cautious when using Bollinger Bands in such market conditions. |
Read Also: Is Google currency conversion accurate? Expert analysis and comparison
Ultimately, the effectiveness of Bollinger Bands for day trading depends on how well it is integrated into an overall trading strategy. It is important to combine Bollinger Bands with other technical analysis tools and indicators to increase the accuracy and reliability of trading signals.
When it comes to day trading, Bollinger Bands can provide traders with several advantages that can help them make more informed decisions and potentially increase their profits. Here are some of the key advantages of using Bollinger Bands in day trading:
| 1. Volatility Measurement | Bollinger Bands are effective in measuring volatility in the market. By calculating the standard deviation of price movements, Bollinger Bands can help traders identify periods of high and low volatility. This information can be useful in determining the appropriate trading strategy to apply for a particular market condition. |
| 2. Trend Identification | Bollinger Bands can assist traders in identifying the direction of a market trend. The upper and lower bands serve as dynamic support and resistance levels. When the price moves towards the upper band, it indicates a bullish trend, while a move towards the lower band suggests a bearish trend. Traders can take advantage of these signals to enter or exit trades. |
| 3. Overbought and Oversold Conditions | Bollinger Bands provide a way to identify overbought and oversold conditions. When the price touches or breaks the upper band, it is considered overbought, and when it touches or breaks the lower band, it is considered oversold. Traders can use this information to anticipate potential reversals in price and adjust their trading strategy accordingly. |
| 4. Price Continuation Patterns | Bollinger Bands can also help traders identify price continuation patterns, such as the squeeze pattern. When the bands narrow, it indicates a period of low volatility, which is often followed by a significant price movement. Traders can watch for a breakout from the squeeze pattern and take advantage of the subsequent price movement. |
| 5. Risk Management | Bollinger Bands can be an effective tool for managing risk in day trading. By setting stop-loss orders near the outer bands, traders can limit their potential losses if the price moves against their position. Additionally, by using Bollinger Bands in conjunction with other indicators or technical analysis tools, traders can confirm or filter out potential trading signals, reducing the risk of false signals. |
Overall, Bollinger Bands can provide day traders with valuable insights into market volatility, trend direction, overbought and oversold conditions, price continuation patterns, and risk management. By incorporating Bollinger Bands into their trading strategy, traders can make more informed decisions and potentially improve their trading results.
Bollinger Bands are a technical analysis tool that consists of a moving average line and two bands that are plotted above and below the moving average. The bands are based on standard deviations and they expand and contract according to market volatility. The upper band represents the overbought zone, while the lower band represents the oversold zone. Traders use Bollinger Bands to identify potential trend reversals and to gauge the volatility of a market.
Bollinger Bands can be effective for day trading as they provide a visual representation of market volatility. Traders can use Bollinger Bands to identify potential entry and exit points based on the price movement within the bands. However, it is important to note that Bollinger Bands should not be used as the sole indicator for making trading decisions. They should be used in conjunction with other technical analysis tools to increase the probability of successful trades.

One advantage of using Bollinger Bands in day trading is that they provide a clear visual representation of market volatility. The bands expand and contract based on market conditions, allowing traders to identify periods of high or low volatility. Additionally, Bollinger Bands can be used to identify potential trend reversals and to set stop-loss levels. Traders can also use the bands to measure the strength of a trend.
One disadvantage of using Bollinger Bands in day trading is that they can give false signals in ranging or sideways markets. When the price is trading within the bands, it can be difficult to determine whether the market will continue the current trend or reverse. Additionally, Bollinger Bands should not be used as the sole indicator for making trading decisions. Traders should use other technical analysis tools and consider other market factors before entering or exiting a trade.
Yes, Bollinger Bands can be used in conjunction with other technical indicators to increase the accuracy of trading signals. For example, traders may use Bollinger Bands in combination with a momentum oscillator like the Relative Strength Index (RSI) to confirm overbought or oversold conditions. They can also use Bollinger Bands with moving averages to identify potential support and resistance levels. Using multiple indicators can help traders confirm trends and make better trading decisions.
Bollinger Bands are a technical analysis tool that consists of a middle line (usually a simple moving average) and two standard deviation lines, which are placed above and below the middle line. The standard deviation lines widen or contract depending on market volatility. They are used to identify potential entry and exit points in trades.

What does 30% OTE mean? When it comes to sales, one term that often comes up is “30% OTE”. But what does it mean? And why is it important? OTЕ stands …
Read Article
Should I Get Euros or Turkish Lira? When planning a trip to Turkey, one of the important decisions you have to make is whether to exchange your …
Read Article
Setting Targets in Forex: A Comprehensive Guide Setting targets is a crucial step in achieving success in the forex market. Without clear goals, …
Read Article
What is the parity price of an option? Options trading can be an exciting but complex endeavor. As an investor, it’s important to have a firm grasp on …
Read Article
Using MT4 on Your iPhone: Everything You Need to Know Do you want to stay connected to the forex market at all times? With MetaTrader 4 (MT4) on your …
Read Article
Strategies for Making Money with Forex Trading Forex, short for foreign exchange, is the global decentralized market where currencies are traded. It …
Read Article


