


How Many Shares of Stock Should a Startup Have? Expert Advice and Insights
What is the ideal number of shares of stock for a startup? When starting a new company, one of the most important decisions entrepreneurs have to make …
Read Article
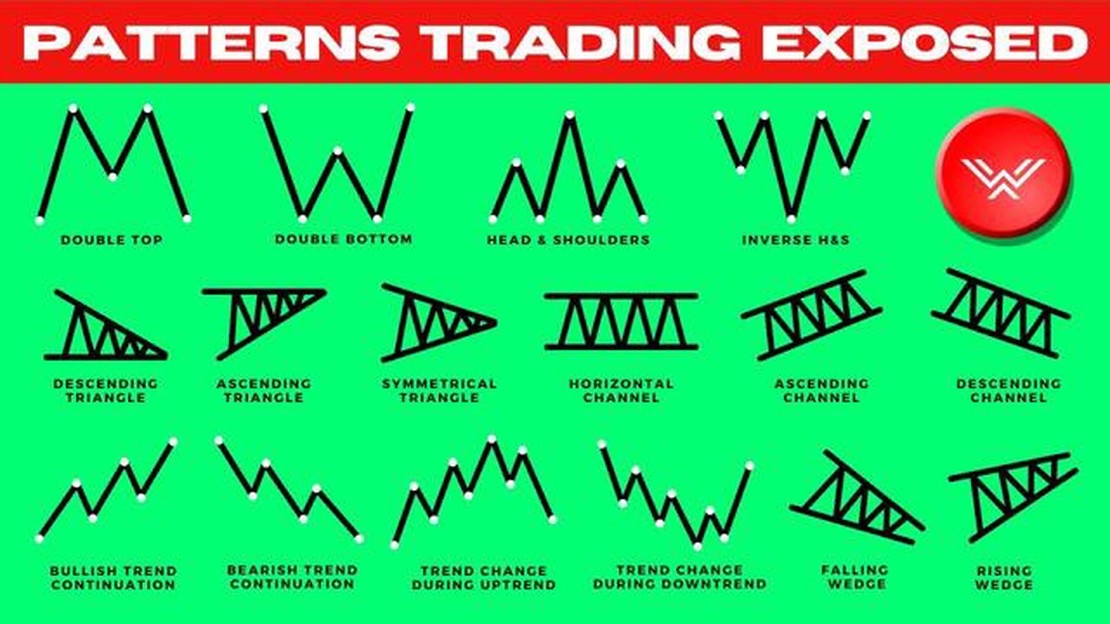
In the world of forex trading, chart patterns are an essential tool for traders to predict market movements and make informed trading decisions. Chart patterns are formed by the price movements of currency pairs over time and can provide valuable insights into future price trends. By learning how to spot and identify these patterns, traders can gain an edge in the forex market.
One of the most common chart patterns in forex trading is the triangle pattern. This pattern is formed when the price of a currency pair consolidates between two converging trend lines, creating a triangle shape on the chart. Traders often look for a breakout from the triangle pattern, as it can signal a future price movement in the direction of the breakout.
Another popular chart pattern is the head and shoulders pattern. This pattern consists of three peaks, with the middle peak (the head) being the highest and the two side peaks (the shoulders) being lower. This pattern is often seen as a reversal pattern, indicating a potential trend change. Traders look for a neckline, which is a support level connecting the lows of the two shoulders, and a break below this neckline can signal a bearish reversal.
Additionally, the double top and double bottom patterns are also widely used in forex trading. The double top pattern is formed when the price reaches a high level, pulls back, and then reaches a similar high level again, creating two peaks on the chart. This pattern is seen as a bearish reversal signal, as it indicates that buyers are failing to push the price higher. On the other hand, the double bottom pattern is the opposite of the double top, with two lows indicating a bullish reversal signal.
Understanding and recognizing chart patterns is an essential skill for forex traders. By being able to identify these patterns, traders can anticipate potential price movements and make more informed trading decisions. Whether it’s the triangle, head and shoulders, or double top and bottom patterns, mastering chart pattern analysis can greatly enhance a trader’s success in the forex market.
Chart patterns are visual representations of price movements in the Forex market. By understanding and accurately identifying these patterns, traders can gain valuable insights into future price movements and make more informed trading decisions. In this ultimate guide, we will explore the most common chart patterns that occur in Forex trading and discuss effective strategies for identifying and using them.
One of the most basic chart patterns is the trendline, which is created by connecting a series of higher lows in an uptrend or lower highs in a downtrend. Traders can identify a trend reversal when the trendline is broken, indicating a potential shift in market sentiment. Another popular pattern is the head and shoulders, characterized by three peaks, with the middle peak being higher than the other two. This pattern suggests a potential trend reversal from bullish to bearish.
Triangles are also common chart patterns, and they can be symmetrical, ascending, or descending. A symmetrical triangle forms when the highs and lows of the price converge to create a narrowing pattern. An ascending triangle occurs when there is a horizontal resistance level and an upward-sloping trendline. Conversely, a descending triangle forms when there is a horizontal support level and a downward-sloping trendline. Both ascending and descending triangles can indicate potential breakouts in the direction of the trend.

Another important chart pattern is the double top and double bottom. A double top is formed when there are two consecutive peaks of similar height, with a retracement between them. This pattern suggests a potential trend reversal from bullish to bearish. Conversely, a double bottom occurs when there are two consecutive troughs with a retracement between them, indicating a potential trend reversal from bearish to bullish.
Additionally, there are flag and pennant patterns, which are continuation patterns. Flags are rectangular-shaped patterns that occur after a sharp price movement, signaling a temporary pause before the price continues in the same direction. Pennants, on the other hand, are triangular-shaped patterns that form after a sharp price movement, suggesting a temporary consolidation before the trend resumes.
Traders can identify these chart patterns by using technical analysis tools, such as trendlines, support and resistance levels, and various indicators. It is important to analyze these patterns in combination with other factors, such as volume and market sentiment, to confirm their validity and make more accurate trading decisions.
In conclusion, identifying and understanding chart patterns is a crucial skill for Forex traders. By recognizing these patterns and applying effective strategies, traders can enhance their analysis and make more profitable trades in the Forex market.
Read Also: Understanding PTS in Trading: A Comprehensive Guide
Candlestick patterns are an essential tool for any forex trader looking to boost their trading strategy. These patterns provide valuable insights into market psychology and can help traders make more informed trading decisions.
There are several key candlestick patterns that traders should be familiar with. The first and most basic is the “doji” candlestick, which indicates indecision in the market. A doji candlestick has a small body and represents a balance between buyers and sellers. This pattern often signals a potential reversal or a period of consolidation.
Read Also: Swing Trading Weekly Options: Tips and Strategies for Success
Another important candlestick pattern is the “hammer” or “hanging man” pattern. This pattern consists of a small body with a long lower shadow, indicating a potential reversal from a downtrend to an uptrend or vice versa. The hammer pattern suggests that buyers have come into the market and are pushing prices higher.
The “engulfing” pattern is a strong reversal pattern that occurs when a larger candle completely engulfs the previous smaller candle. The engulfing pattern can indicate a shift in market sentiment and can be a powerful signal for traders. A bullish engulfing pattern occurs when a bearish candle is followed by a larger bullish candle, signaling a potential uptrend. Conversely, a bearish engulfing pattern occurs when a bullish candle is followed by a larger bearish candle, signaling a potential downtrend.
The “shooting star” and “inverted hammer” patterns are similar to the hammer pattern but occur at the top of an uptrend. These patterns indicate a potential reversal from an uptrend to a downtrend. The shooting star has a small body with a long upper shadow, while the inverted hammer has a small body with a long upper shadow.
It is important for forex traders to be able to identify and understand these candlestick patterns as they can provide valuable insights into market behavior and help in making profitable trading decisions. By incorporating candlestick patterns into their trading strategy, traders can increase their chances of success in the forex market.

Chart patterns in forex trading are specific formations or shapes that appear on price charts and provide important information about the potential direction of future price movements. They can help traders identify possible trend reversals or continuations.
Spotting chart patterns in forex trading is important because they can provide valuable insights into the market sentiment and help traders make informed decisions. By recognizing these patterns, traders can identify potential entry and exit points, manage their risks, and increase their chances of making profitable trades.
Some common chart patterns in forex trading include the head and shoulders pattern, the double top and double bottom patterns, the triangle pattern, the flag pattern, and the pennant pattern. These patterns have specific characteristics that traders can use to identify them on price charts.
Traders can identify chart patterns by carefully analyzing price charts and looking for specific shapes or formations. They can use technical analysis tools like trendlines, support and resistance levels, and moving averages to help confirm the presence of a chart pattern. Traders should also consider the timeframe they are trading on, as chart patterns may appear differently on different timeframes.
After spotting a chart pattern, traders should wait for confirmation before taking any action. They can look for additional technical indicators or signals to confirm the pattern and its potential outcome. Traders should also consider risk management strategies and set appropriate stop-loss orders to protect their investments.
Chart patterns in forex trading are visual representations of price movements on a price chart that traders use to identify potential trading opportunities. These patterns are formed when the price action of a currency pair creates a certain formation or shape on the chart, and they can provide insight into the future direction of price movements.
Chart patterns are important in forex trading because they can help traders identify potential entry and exit points for trades. By understanding and recognizing chart patterns, traders can make more informed decisions and increase their chances of profitability in the market.

What is the ideal number of shares of stock for a startup? When starting a new company, one of the most important decisions entrepreneurs have to make …
Read Article
Understanding the Iceberg Trade Strategy Are you looking for a trading strategy that can help you maximize your profit potential? Look no further than …
Read Article
Details of the New York Rangers Trade In the dynamic world of professional hockey, team rosters are in a constant state of flux. The New York Rangers, …
Read Article
Understanding the Duration of Binary Options Binary options are a type of financial derivative that allow traders to speculate on the movement of …
Read Article
When does trading on the forex exchange start? The forex market, also known as the foreign exchange market, is a global decentralized market where …
Read Article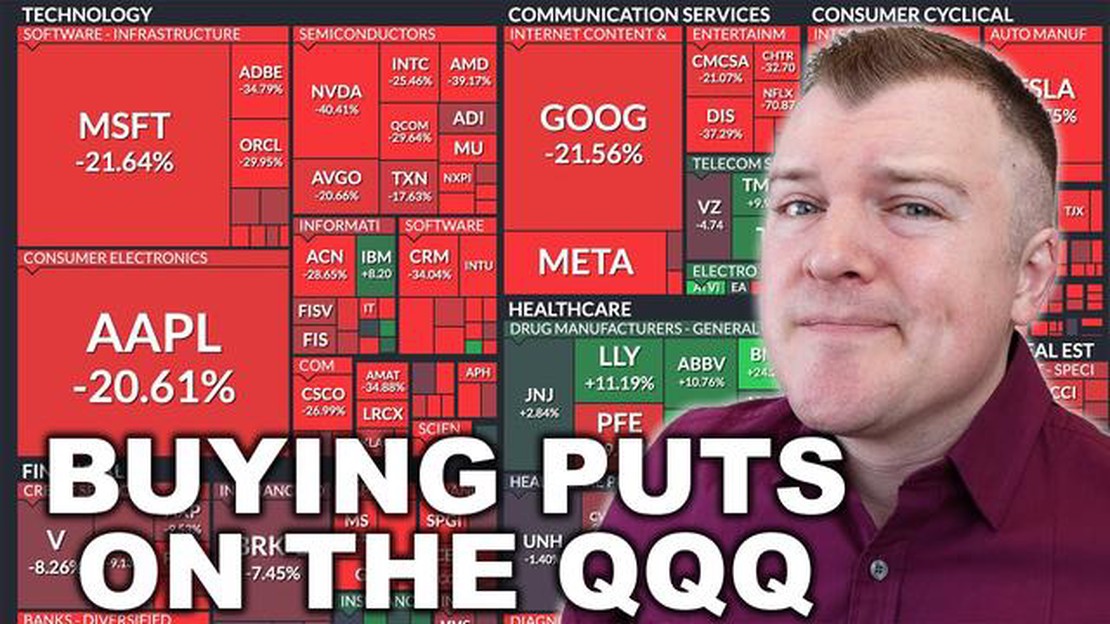
Can you buy puts on QQQ? Buying put options on the popular exchange-traded fund (ETF) QQQ, which tracks the performance of the Nasdaq 100 Index, can …
Read Article


