


Exploring Cabinet Trade Options: What You Need to Know
What is a cabinet trade options? In the world of international trade, cabinets play a crucial role in facilitating the exchange of goods and services …
Read Article
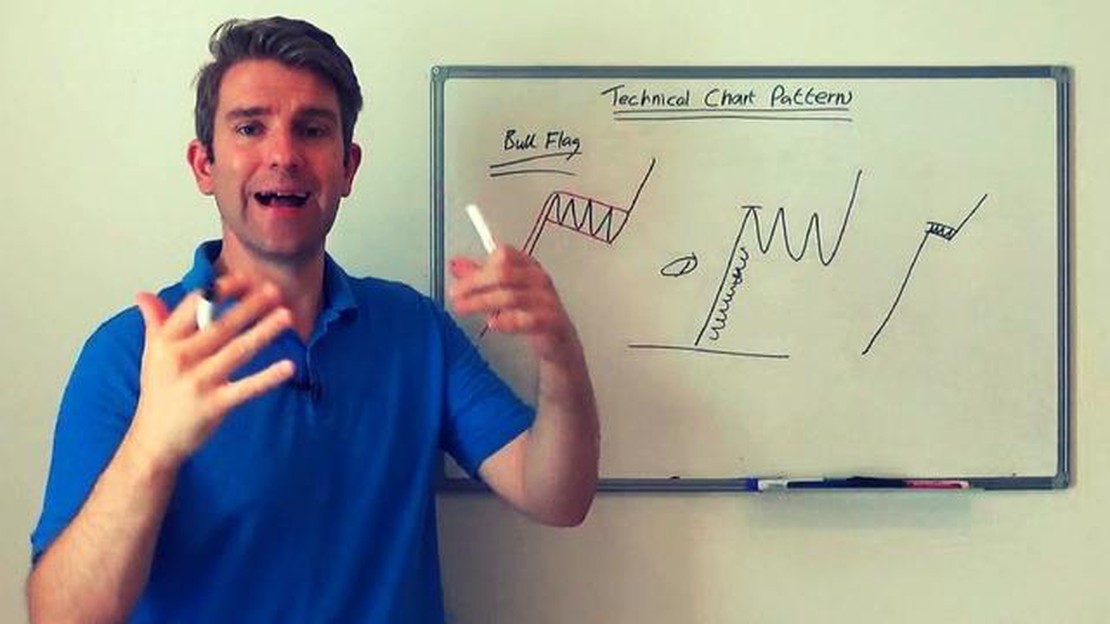
Trading in the financial markets requires careful analysis and the ability to identify patterns that can indicate future price movements. One such pattern that traders commonly use is the flag pattern. A flag pattern is a technical analysis pattern that occurs after a strong price movement and represents a consolidation period before the price continues in the direction of the original trend.
To recognize a flag pattern, traders look for two main components: a strong price movement, called the flagpole, and a rectangular or parallelogram-shaped consolidation area, called the flag. The flag is formed as the price retraces a portion of the flagpole’s gains in a sideways or slightly downward movement. This consolidation period indicates that traders are taking a break and adjusting their positions before the price continues its upward or downward trend.
The flag pattern is considered a continuation pattern, meaning that it signifies a pause in the market trend before it resumes. Traders often use the flag pattern to predict the future price movement, as it suggests that the price will continue in the direction of the initial breakout. For example, if the price broke out to the upside, traders would expect it to continue rising after the flag pattern completes.
Identifying a flag pattern requires a keen eye and attention to detail. Traders often use technical analysis tools, such as trend lines and moving averages, to confirm the presence of a flag pattern. Additionally, they look for signs of a strong price movement preceding the flag, as well as a clear consolidation area that meets the criteria of a flag shape. By recognizing and identifying this pattern, traders can make more informed trading decisions and potentially profit from the continuation of the trend.
A flag pattern is a commonly seen chart pattern in technical analysis that can help traders identify potential opportunities in the market. It is a continuation pattern that indicates a temporary pause or consolidation in price movement before the prevailing trend resumes.
Here are some tips on how to spot flag patterns in trading:
Remember that flag patterns are just one tool in technical analysis, and it is important to consider other factors and indicators before making any trading decisions. Practice identifying flag patterns on historical charts and observe how they play out in real-time to improve your pattern recognition skills.

By successfully recognizing and identifying flag patterns, traders can potentially capitalize on price continuation opportunities and improve their trading performance.
There are two main types of flag patterns: bullish flags and bearish flags. A bullish flag pattern occurs when the flag is slanted upward, indicating that the price is likely to continue rising. Conversely, a bearish flag pattern occurs when the flag is slanted downward, indicating that the price is likely to continue falling.
One key characteristic of flag patterns is that they tend to have high trading volume during the flag pole phase, which then tapers off during the consolidation phase. This decrease in volume indicates a temporary pause in market activity, as traders take a break to assess the situation before resuming their trading activities.
Traders can use the height of the flag pole to estimate the potential price target once the pattern is completed. The target is typically calculated by measuring the length of the flag pole and adding it to the breakout point, where the price breaks out of the consolidation phase. This can provide a target to set profit targets or determine where to place stop-loss orders.
Read Also: Who Manages Forex? - Understanding the Management Structure of the Forex Market
It’s important to note that flag patterns are not always reliable indicators and should be used in conjunction with other technical analysis tools to confirm signals. Additionally, like any pattern, there can be false breakouts where the price does not follow the expected direction. Traders should always exercise caution and use appropriate risk management techniques when trading flag patterns.
Flag patterns are a type of chart pattern that can be observed in technical analysis. They are formed when a strong price movement, known as the flagpole, is followed by a period of consolidation which forms the flag. Flag patterns can be either bullish or bearish and offer valuable information about the future direction of the price.
1. Shape: Flag patterns typically have a rectangular shape. The flagpole represents the initial sharp price movement, while the flag itself is characterized by parallel trend lines that slope in the opposite direction of the flagpole.
2. Duration: Generally, flag patterns have a relatively short duration. The flags are usually formed within 1 to 4 weeks. The length of the flagpole can provide an indication of the potential price target once the pattern is confirmed.
Read Also: Find Out Which Broker Offers Binary Options | Trading Platform Comparison
3. Volume: In most cases, the volume tends to decline during the formation of the flag. This decrease in volume indicates a decrease in trading activity and can be seen as a sign of market consolidation.
4. Breakout: The pattern is considered to be completed when the price breaks out of the flag formation. A breakout above the upper trend line of a bullish flag pattern or below the lower trend line of a bearish flag pattern confirms the pattern and signals a potential continuation of the previous trend.
5. Target: To calculate the potential price target of a flag pattern, measure the length of the flagpole and add it to the breakout point. This projected target can serve as a profit target for traders.
Remember that flag patterns are just one tool among many in technical analysis, and it is important to consider multiple indicators and patterns when making trading decisions.

A flag pattern in trading is a chart pattern that occurs after a strong price movement. It is characterized by a rectangular shape formed by two parallel trendlines. The flag pattern indicates a brief consolidation period before the price continues in the same direction as the preceding trend.
You can recognize a flag pattern by looking for a strong price movement followed by a consolidation period. The consolidation period is characterized by a rectangular shape formed by two parallel trendlines. The flag pattern is typically sloping in the opposite direction of the preceding trend.
A flag pattern indicates a brief consolidation period in the market before the price continues in the same direction as the preceding trend. It suggests that traders are taking a pause and reevaluating their positions before the price resumes its trend. The flag pattern is often seen as a continuation pattern.
You can use a flag pattern in your trading strategy by looking for opportunities to enter or exit trades. When the price breaks out of the flag pattern in the direction of the preceding trend, it can be a signal to enter a trade in that direction. You can also use the height of the flagpole to estimate a price target.
Flag patterns are considered to be reliable indicators in trading. They often indicate a continuation of the preceding trend and can provide traders with opportunities to enter or exit trades. However, it is essential to combine the analysis of flag patterns with other technical indicators and risk management strategies.

What is a cabinet trade options? In the world of international trade, cabinets play a crucial role in facilitating the exchange of goods and services …
Read Article
Activate Option Trading in Sharekhan: The Complete Guide Sharekhan is a popular online brokerage firm that provides a wide range of trading and …
Read Article
Is eToro Binary? Binary options trading is a popular method of financial trading in which traders can choose between two possible outcomes, whether …
Read Article
Are stock options included in shares outstanding? When evaluating a company’s financial health and investment potential, one important metric to …
Read Article
Best FX Broker in Nigeria: Find the Top Brokerage for Forex Trading in Nigeria When it comes to forex trading, having the right broker is essential …
Read Article
How to Find a Good Stock for Options Trading Options trading is a popular investment strategy that offers the potential for significant returns. …
Read Article


