


Exploring European Options in India: A Guide for Travelers
Exploring European Options in India India, with its vibrant culture, stunning landscapes, and rich history, is a country that offers a multitude of …
Read Article
Candlestick patterns are a powerful tool in technical analysis, helping traders to predict future price movements in the financial markets. One of the key types of candlestick patterns is the bullish candlestick, indicating a potential upward trend in the price of an asset. Understanding how to identify bullish candlesticks can give traders a significant advantage in their decision-making process.
Bullish candlesticks are characterized by a long green body, indicating that the price of the asset opened at a lower level and closed at a higher level during a specific time period. In addition to the body, there are two other important components of a bullish candlestick: the upper shadow and the lower shadow. The upper shadow represents the highest price reached during the time period, while the lower shadow represents the lowest price.
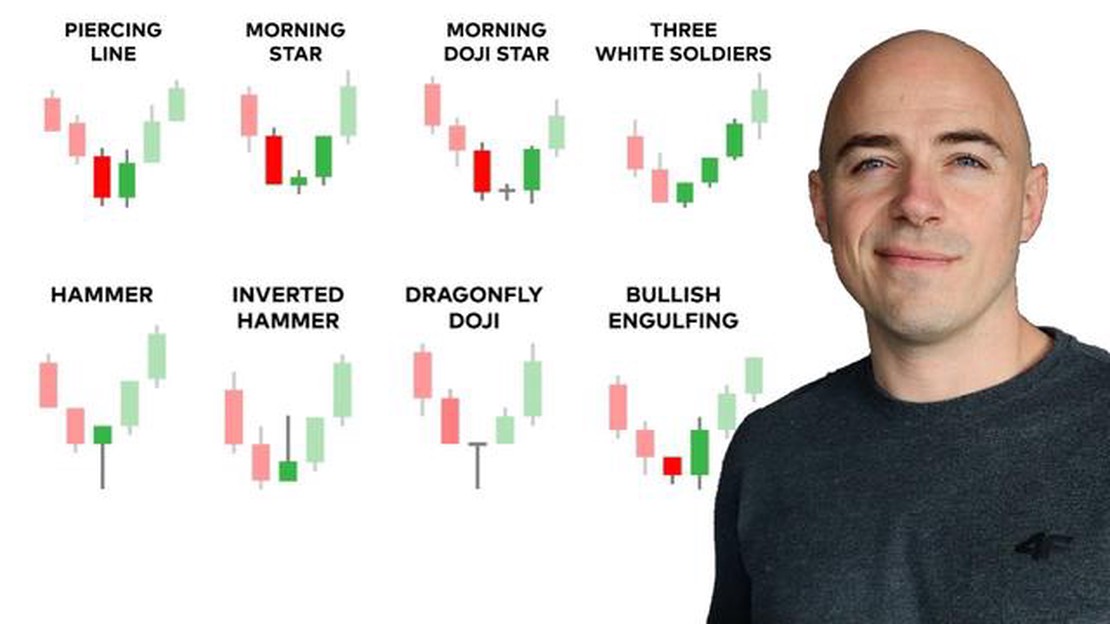
One widely recognized bullish candlestick pattern is the “bullish engulfing” pattern. This pattern occurs when a small bearish candlestick is followed by a larger bullish candlestick, completely engulfing the body of the previous candlestick. It is a strong signal of a potential trend reversal from bearish to bullish.
Another important bullish candlestick pattern is the “hammer” pattern. This pattern consists of a small body with a long lower shadow and little to no upper shadow. The hammer pattern indicates that buyers have overcome sellers, resulting in a potential reversal from a downtrend to an uptrend. Traders often look for confirmation by observing the price action in the following candlesticks.
When it comes to analyzing price charts in technical analysis, candlestick charts are one of the most widely used tools. Bullish candlesticks are an important aspect of these charts and can provide valuable insights into the potential future direction of a security’s price.
In this step-by-step guide, we will explore what bullish candlesticks are and how to identify them. Understanding these patterns can help traders make more informed decisions when it comes to buying or selling assets.
 7. Types of Bullish Candlestick Patterns
There are several types of bullish candlestick patterns, including:
8. Hammer: characterized by a small body and a long lower shadow
9. Engulfing: occurs when a larger bullish candle completely engulfs the previous bearish candle
10. Doji: has equal or nearly equal open and close prices, indicating indecision in the market
11. Piercing Line: formed by a long bearish candle followed by a bullish candle that opens below the previous close but closes above the midpoint
12. Morning Star: consists of three candles – a long bearish candle, a short bearish or bullish candle with a small body, and a long bullish candle
13. Using Bullish Candlesticks in Trading
Traders can use bullish candlestick patterns as part of their trading strategy. When identified correctly, these patterns can signal potential buying opportunities, indicating that the market sentiment is shifting towards the bulls. However, it is important to consider other technical indicators and factors before making trading decisions.
7. Types of Bullish Candlestick Patterns
There are several types of bullish candlestick patterns, including:
8. Hammer: characterized by a small body and a long lower shadow
9. Engulfing: occurs when a larger bullish candle completely engulfs the previous bearish candle
10. Doji: has equal or nearly equal open and close prices, indicating indecision in the market
11. Piercing Line: formed by a long bearish candle followed by a bullish candle that opens below the previous close but closes above the midpoint
12. Morning Star: consists of three candles – a long bearish candle, a short bearish or bullish candle with a small body, and a long bullish candle
13. Using Bullish Candlesticks in Trading
Traders can use bullish candlestick patterns as part of their trading strategy. When identified correctly, these patterns can signal potential buying opportunities, indicating that the market sentiment is shifting towards the bulls. However, it is important to consider other technical indicators and factors before making trading decisions.
Read Also: Is Forex Trading Haram? Clarifying the Halal Status of Forex Trading
By understanding bullish candlesticks and their various patterns, traders can gain valuable insights into market trends and make more informed trading decisions. It is important to combine candlestick analysis with other forms of technical analysis to maximize its effectiveness.
Remember, practice and experience are crucial in mastering the art of candlestick analysis. Continuously studying and observing price charts will help develop a trader’s ability to identify and interpret these patterns accurately.
Read Also: Today's Euro to Dollar Exchange Rate: Latest Currency Conversion Update
Bullish candlesticks, also known as up or buy candlesticks, indicate that the price of an asset is likely to go up in the near future. These candlesticks are characterized by several key features:
1. Large body: Bullish candlesticks have a large body, which represents the price range between the opening and closing prices. The larger the body, the stronger the bullish sentiment.
2. Closing price above the opening price: The closing price of a bullish candlestick is higher than the opening price. This indicates that buyers have dominated the market and pushed the price up.
3. Long lower shadow: Bullish candlesticks often have a long lower shadow, also known as a lower wick. This shows that the price temporarily went down during the trading period but quickly recovered, indicating strong buying pressure.

4. Absence of upper shadow: Bullish candlesticks usually have little or no upper shadow, indicating that the price remained high throughout the trading period.
5. High volume: Bullish candlesticks are often accompanied by high trading volume, as more buyers are entering the market and pushing the price up.
6. Continuation or reversal: Bullish candlesticks can either indicate a continuation of an existing bullish trend or a potential reversal from a bearish trend.
7. Confirmation: It is important to look for confirmation signals, such as bullish indicators or patterns, to validate the bullish candlestick and reduce the risk of false signals.
By understanding the key characteristics of bullish candlesticks, traders can identify potential buying opportunities and make informed decisions when trading in financial markets.
A bullish candlestick is a type of candlestick chart pattern that indicates a potential upward movement in the price of an asset. It is characterized by a long body with a small or no shadow on the top and a long lower shadow.
To identify a bullish candlestick on a chart, look for a candle with a long body and a small or no shadow on the top, along with a long lower shadow. This pattern suggests that buyers have taken control of the market and the price may continue to rise.
Some common bullish candlestick patterns include the hammer, the engulfing pattern, the morning star pattern, and the piercing pattern. These patterns can provide signals that the price is likely to increase.
Trading based on bullish candlestick patterns can provide several benefits. These patterns can help identify potential entry and exit points for trades, as well as provide an indication of the overall trend in the market. By using these patterns in conjunction with other technical analysis tools, traders can make more informed trading decisions.

Exploring European Options in India India, with its vibrant culture, stunning landscapes, and rich history, is a country that offers a multitude of …
Read Article
Understanding Outward Remittance: Everything You Need to Know Outward remittance refers to the process of sending money from one country to another. …
Read Article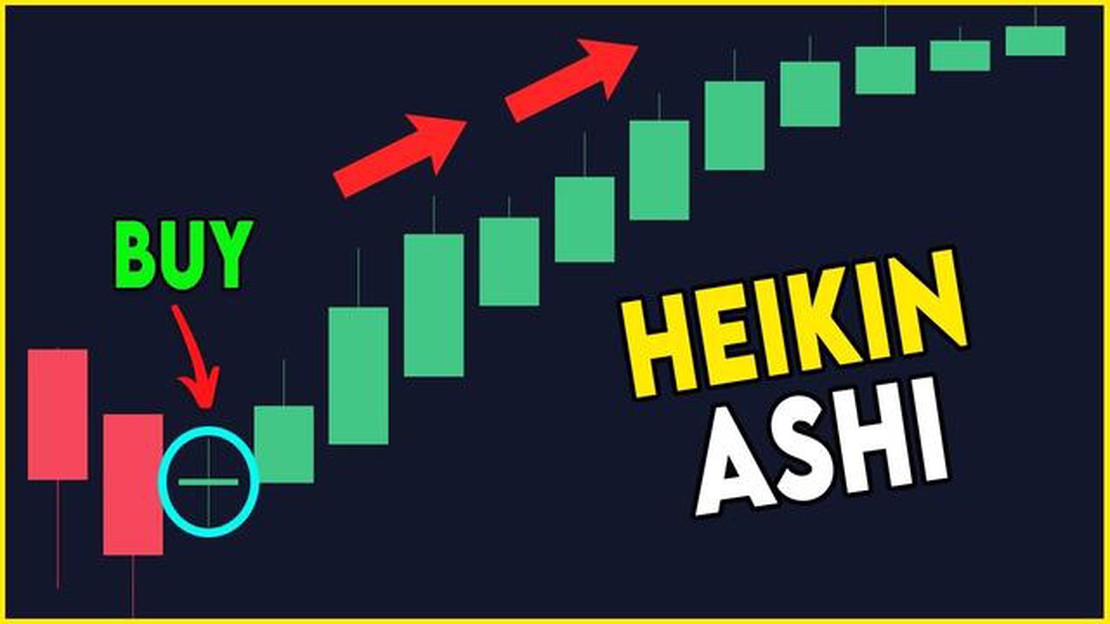
Formula for Smooth Heiken Ashi Explained When it comes to trading the financial markets, reliable signals are crucial. Traders need to have an …
Read Article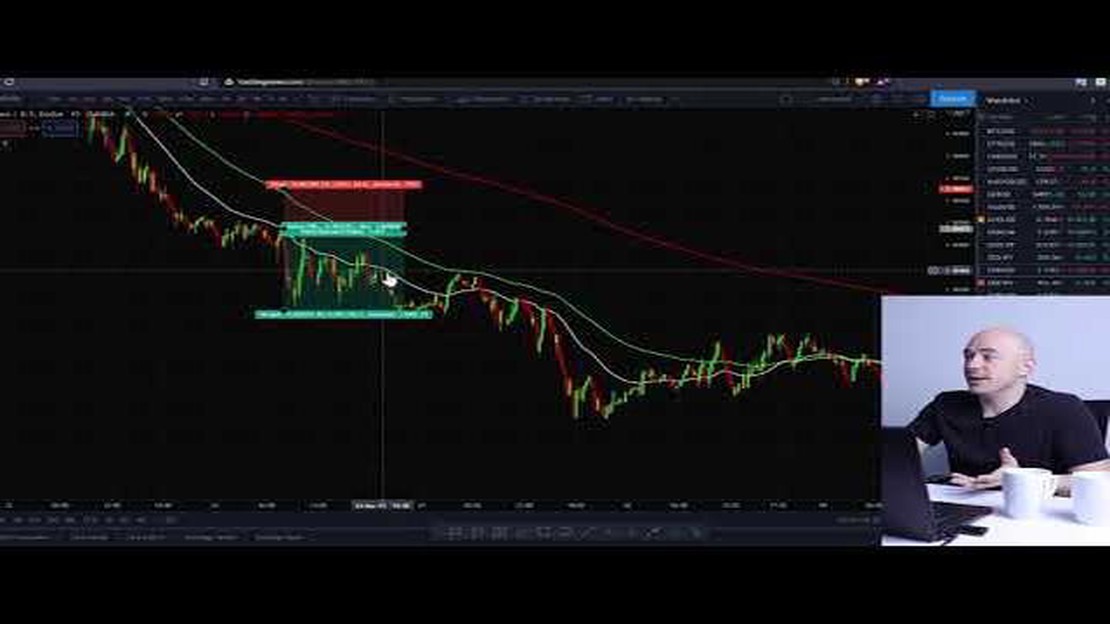
How to Set Stop Loss and Take Profit? When it comes to trading in the financial markets, managing risk is essential. One of the most effective ways to …
Read Article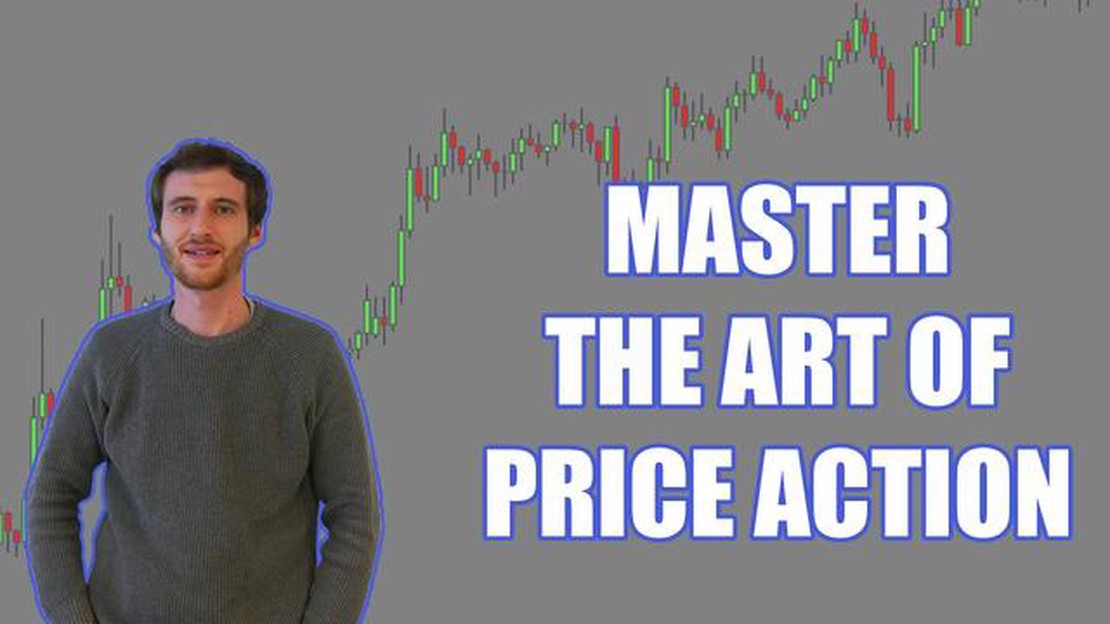
Master the Art of Forex Strategies: A Comprehensive Guide When it comes to trading on the foreign exchange market, having a strong understanding of …
Read Article
Understanding the Difference Between Phantom and ESOP Phantom Stock Options and Employee Stock Option Plans (ESOP) are two types of equity …
Read Article


