

Can You Trade Currency Options on Interactive Brokers? - Exploring Your Options
Trading Currency Options on Interactive Brokers If you are an investor looking to trade currency options, it is important to find a reliable and …
Read Article
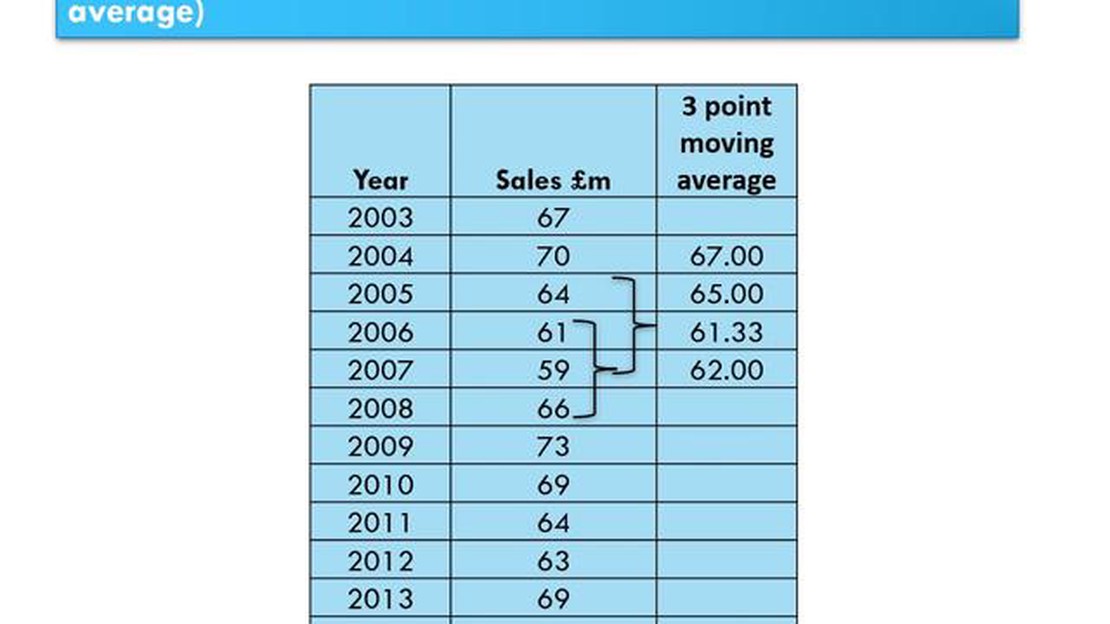
Forecasting future values is a crucial aspect of decision-making in various fields, such as finance, sales, and economics. One popular technique used for short-term forecasting is the 3-period moving average. This method involves taking the average of the previous three data points to predict future values.
The concept behind the 3-period moving average is simple yet effective. By calculating the average of the last three data points, this method smooths out short-term fluctuations and provides a clearer trend. It is particularly useful when the data shows regular patterns or seasonality.
To calculate the 3-period moving average, add up the values of the most recent three data points and divide the sum by three. This will give you the average value. When a new data point becomes available, drop the oldest data point from the calculation and include the new one.
Example:
Consider a monthly sales data set: 200, 250, 300, 280, 320, 350. To forecast the next month’s sales using the 3-period moving average, add up the sales for the most recent three months (300 + 280 + 320 = 900) and divide by three (900 / 3 = 300). The forecasted sales for the next month would be 300.
The accuracy of the forecast using the 3-period moving average will depend on the data pattern and the number of previous periods considered. The more data points you include in the calculation, the smoother the forecast will be, but the slower it will react to changes in the trend.
In conclusion, the 3-period moving average is a simple and effective method for short-term forecasting. By taking the average of the most recent three data points, this technique provides a smoother trend and helps predict future values. However, it is important to consider the limitations of this method and adjust the number of periods used based on the data pattern and the desired level of responsiveness.
A moving average is a popular statistical technique used to analyze and forecast data in time series analysis. It is a calculation that helps to identify patterns and trends in a set of data points by smoothing out the fluctuations between individual data points.

The moving average is calculated by taking the average of a specific number of data points over a certain period of time. This period is often called the “window” or “span” of the moving average. The most common type of moving average is the simple moving average (SMA), which calculates the average of the data points within the window.
There are various types of moving averages, including the 3-period moving average. This type of moving average calculates the average of the last three data points. It is often used to forecast short-term trends and predict future data points based on the recent behavior of the data.
One of the key benefits of using moving averages is that they help to smooth out the noise or volatility in the data, making it easier to identify underlying trends or patterns. They can also help to reduce the impact of outliers or extreme values that may skew the analysis.
Read Also: Is Black-Scholes a binomial model? Exploring the relationship between the Black-Scholes pricing model and binomial models
Moving averages can be used in a wide range of applications, such as finance, stock market analysis, weather forecasting, and sales forecasting. They provide a simple yet powerful tool for analyzing and predicting trends in time series data.
It is important to note that moving averages are a lagging indicator, which means that they are based on past data and may not always accurately predict future trends. They should be used in conjunction with other forecasting techniques and analysis methods for more accurate and reliable results.
In conclusion, moving averages are a valuable tool for understanding and forecasting data in time series analysis. They help to smooth out fluctuations, identify trends, and predict future data points. By using moving averages, analysts can gain insights into the underlying patterns and make more informed decisions based on the data.
One popular method of forecasting future data points is by using a moving average. A moving average is a calculation that is used to analyze the trend or pattern in a set of data points. It smooths out the fluctuations and noise in the data, making it easier to identify the underlying trend.
In the case of a 3-period moving average, the calculation is quite simple. It involves taking the average of the current data point and the two previous data points. This results in a single forecasted value that represents the average value of the three periods.
For example, let’s suppose we have the following data points: 10, 15, 20, 25, 30. To calculate the forecasted value for the next period using a 3-period moving average, we would add up the values of the three most recent periods (20, 25, 30) and divide by 3. This gives us a forecasted value of 25 for the next period.
Read Also: Are ISOs Transferable? Find out the Facts and Benefits
The process is then repeated for each subsequent period, using the most recent three data points. This allows us to update our forecast as new data becomes available, providing a more accurate prediction of future values.
It is important to note that using a 3-period moving average may not be appropriate for all data sets. The choice of the number of periods to include in the calculation depends on the nature of the data and the desired level of smoothing. If the data has a lot of noise or volatility, a larger moving average may be more appropriate to capture the long-term trend.
Overall, a 3-period moving average can be a useful tool for forecasting future data points. It helps to identify trends and patterns in the data, making it easier to make informed decisions and predictions. By regularly updating the moving average calculation with new data, you can improve the accuracy of your forecasts and make more reliable projections.

A 3-period moving average is a forecasting technique that calculates the average value of a variable over three consecutive time periods.
A 3-period moving average can be used for forecasting by taking the average of the past three data points and using it to project future values.
The advantages of using a 3-period moving average include simplicity, ease of calculation, and responsiveness to recent trends.
Yes, there are limitations to using a 3-period moving average. It may not capture long-term trends, and it can be less accurate if there are sudden, unexpected changes in the data.
Yes, a 3-period moving average can be used for any type of data that has a time component, such as sales, stock prices, or production volumes.
The 3-period moving average is a forecasting technique that calculates the average of the last three periods of data to predict future values.

Trading Currency Options on Interactive Brokers If you are an investor looking to trade currency options, it is important to find a reliable and …
Read Article
What does TAS stand for in trading? In the world of trading, there are many acronyms and terms that can confuse newcomers. One such acronym that is …
Read Article
What is 123R? 123R, also known as FASB Statement No. 123R, is a financial accounting standard that was issued by the Financial Accounting Standards …
Read Article
Is forex riskier than stocks? When it comes to investing, many people wonder whether Forex or stocks are riskier. Both markets have their own unique …
Read Article
Forex Trading: Skill or Gambling? Forex trading has always been a topic of debate among investors and financial experts. Some argue that it is a …
Read Article
Why is the baht gaining strength? The Thai Baht, the currency of Thailand, has been experiencing a significant strengthening in recent months. This …
Read Article


