


Canadian Dollar Forecast for 2023: Expert Predictions and Analysis
Canadian Dollar Forecast for 2023 The Canadian dollar, also known as the loonie, has been the subject of much speculation and analysis, as experts try …
Read Article
When it comes to analyzing financial markets and making informed investment decisions, technical indicators play a crucial role. One such indicator that has gained popularity among traders is the Hull Moving Average (HMA). Unlike traditional moving averages, the HMA utilizes a unique weighted calculation method to filter out price noise and provide a clearer trend analysis.
The HMA is known for its ability to adapt to market conditions and provide timely signals. By taking into account both short-term and long-term price movements, it aims to identify trends more accurately. However, interpreting the HMA correctly is essential to avoid misleading signals and false breakouts.
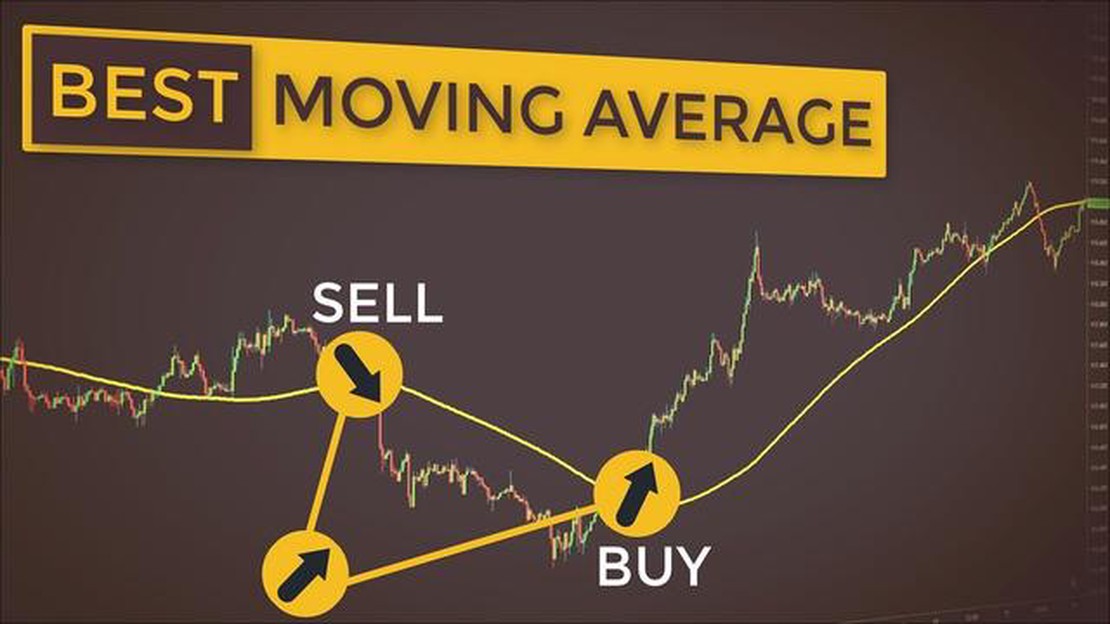
One effective way to interpret the HMA is by looking for crossover signals. When the HMA line crosses above the price action, it signals a potential uptrend. Conversely, when the HMA line crosses below the price action, it indicates a potential downtrend. These crossovers can serve as entry and exit points for trades.

Additionally, paying attention to the slope of the HMA can provide further insight into the strength of the trend. If the HMA line is sloping upwards, it suggests a bullish trend, while a downward sloping HMA line indicates a bearish trend. Traders can use this information to confirm the validity of a trend and adjust their trading strategies accordingly.
It’s important to note that while the HMA can be a valuable tool, it should not be used in isolation. Combining it with other technical indicators and price action analysis can enhance its effectiveness and improve overall trading decisions. Keeping a close eye on market conditions and adapting strategies accordingly is key to successfully interpreting the hull moving average.
A hull moving average (HMA) is a technical indicator used in technical analysis to smoothen price data and identify trends in the market. It differs from traditional moving averages by effectively eliminating lag and providing a more accurate representation of the underlying data.
The HMA is designed to respond quickly to changes in price while remaining smooth and consistent. It achieves this by using weighted moving averages and a square root of a weighted moving average to calculate the final result. This unique calculation formula allows the HMA to stay close to the actual price movement and avoid delays or false signals.
Read Also: Understanding the Expiry Time for Options Trading: What You Need to Know
The principles behind the hull moving average can be summarized as follows:
Traders and analysts use the hull moving average to:
In conclusion, understanding the principles of a hull moving average is essential for effectively interpreting this technical indicator. By using weighted moving averages and the square root function, the HMA provides a more accurate representation of price data and eliminates lag. Traders can leverage the HMA to identify trends, signal entry and exit points, and validate other indicators, ultimately improving their trading decisions.
The hull moving average (HMA) is a popular technical indicator used by traders to identify trends in the stock market. When interpreting the HMA, it is important to look for key signals that can help inform trading decisions.
One key signal to look for is when the HMA line crosses above or below the price line. If the HMA line crosses above the price line, it indicates a bullish signal, suggesting that it may be a good time to buy. Conversely, if the HMA line crosses below the price line, it indicates a bearish signal, suggesting that it may be a good time to sell.
Another important signal to consider is the slope of the HMA line. If the HMA line is sloping upwards, it suggests that the trend is bullish and that prices may continue to rise. On the other hand, if the HMA line is sloping downwards, it suggests that the trend is bearish and that prices may continue to fall.
Read Also: Trading Sentiment in Forex: Strategies and Techniques
In addition to looking at the HMA line itself, it can also be helpful to consider the distance between the HMA line and the price line. If the HMA line is far away from the price line, it may indicate that the trend is strong and that prices are likely to continue moving in that direction. Conversely, if the HMA line is close to the price line, it may suggest that the trend is weakening and that a reversal may be imminent.
Lastly, it is important to pay attention to any divergences between the HMA line and the price line. Divergences occur when the HMA line and the price line move in opposite directions. This can indicate a potential reversal in the trend and may be used as a signal to enter or exit a trade.
In conclusion, when interpreting the hull moving average, traders should look for key signals such as crossovers, slope, distance from the price line, and divergences. These signals can provide valuable information about the current trend and help inform trading decisions.
A hull moving average (HMA) is a type of moving average that combines different weighted moving averages to provide a smoother and more responsive trend line. It is designed to address the lagging issue of traditional moving averages and is often used by traders and analysts to identify market trends and potential entry or exit points.

The hull moving average is considered effective because it provides a smoother and more responsive trend line compared to traditional moving averages. This helps traders and analysts to filter out market noise and identify the underlying trend more accurately. Additionally, the hull moving average is designed to reduce lag, which means it can provide timely signals for potential entry or exit points.

Canadian Dollar Forecast for 2023 The Canadian dollar, also known as the loonie, has been the subject of much speculation and analysis, as experts try …
Read Article
Understanding a rolling spot forex transaction Foreign exchange trading, also known as Forex, is a decentralized global market where currencies are …
Read Article
Current exchange rate: 1 dollar to zloty If you are planning to travel to Poland or simply curious about the exchange rate between the dollar and the …
Read Article
Is FBS available for use in USA? FBS is a popular online trading platform that offers a wide range of financial services to traders worldwide. With …
Read Article
Is 20 too early to move out? In today’s world, the concept of moving out at the age of 20 has become increasingly common. Many young adults are eager …
Read Article
Do Forex Robots Work on Android? In recent years, forex trading has become increasingly popular, with more and more people seeking to make profits in …
Read Article


