

Choosing the Best Indicator to use with Fractals: A Comprehensive Guide
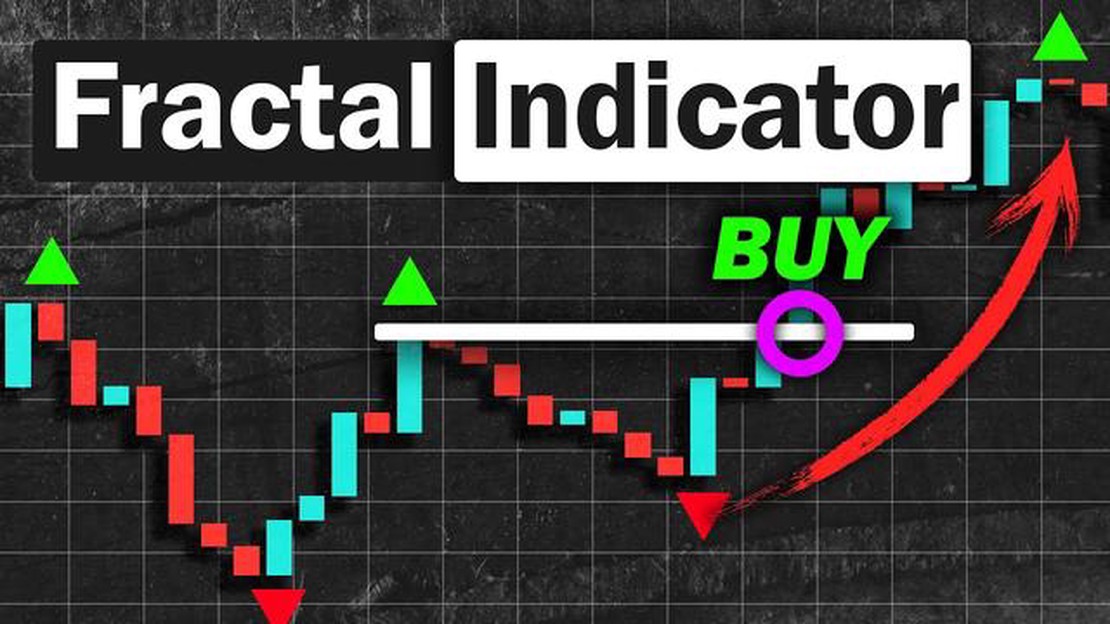
Best Indicator to Use with Fractals Fractals are powerful tools in technical analysis that can help identify and confirm trends in financial markets. …
Read Article
When analyzing data, it can be helpful to calculate moving averages to identify trends and patterns over a specified period of time. One commonly used moving average is the 7-day moving average, which calculates the average of a variable over the past week.
Calculating the 7-day moving average involves adding up the values of the variable for the past 7 days and then dividing the sum by 7. This moving average gives equal weight to each day in the past week, providing a smoothed average that can help in identifying trends more easily.
To calculate the 7-day moving average, you will need a dataset that includes the variable you want to analyze and the corresponding dates. Start by selecting a starting point in your dataset, typically a week after the first available data point. Add up the values of the variable for the past 7 days, including the current day. Divide the sum by 7 to calculate the 7-day moving average for that day.
Repeat this process for each subsequent day in your dataset, shifting the window of the past 7 days as you move along. The resulting 7-day moving average values can then be used to identify trends and patterns in the data, smoothing out any daily fluctuations and providing a clearer picture of the overall trend.
In conclusion, calculating the 7-day moving average is a useful tool for analyzing data and identifying trends over a specific time period. By following these step-by-step instructions, you can easily calculate the 7-day moving average and gain insights into the underlying patterns in your data.
A moving average is a statistical calculation used to analyze time series data by creating a series of averages of different subsets of the full data set. It is commonly used in finance and trading to identify trends and forecast future prices.
The moving average is calculated by taking the average value of a specified number of data points over a certain period of time. For example, a 7-day moving average calculates the average of the last 7 days of data. As new data points become available, the moving average is updated to include the latest information.
The moving average filters out short-term fluctuations and provides a smoother representation of the underlying data trend. This makes it easier to identify long-term trends and patterns, and can help traders make more informed decisions.
There are different types of moving averages, such as the simple moving average (SMA) and the exponential moving average (EMA). The SMA gives equal weight to each data point in the subset, while the EMA gives more weight to recent data points.

The moving average is often used in conjunction with other technical analysis tools, such as support and resistance levels, to confirm trading signals and improve the accuracy of predictions.
Overall, the moving average is a powerful tool for analyzing time series data and can be applied in various fields, including finance, economics, and stock market analysis.
Read Also: Understanding the Function of a Sell Stop in Forex Trading
The 7-day moving average is a statistical calculation that helps to smooth out fluctuations in data over a specific period of time. It is used to analyze trends and patterns, and is often applied to financial data, stock prices, and other time series data.
The purpose of calculating the 7-day moving average is to provide a clearer picture of the overall trend by eliminating short-term fluctuations and noise in the data. By averaging the values over a specific time frame, the 7-day moving average helps to reveal the underlying pattern and identifies any long-term upward or downward trends.
The 7-day moving average is a commonly used tool in technical analysis and is considered to be a reliable indicator of the overall market sentiment. It is often used to identify potential buying or selling opportunities and to make informed decisions in various trading strategies.
To calculate the 7-day moving average, you sum up the values of the data over a 7-day period and then divide it by 7. This process is repeated for each consecutive 7-day period in the data set. The resulting averages are plotted on a graph to visualize the trend over time.
The 7-day moving average provides a smoother representation of the data, making it easier to identify trends and changes in the overall pattern. It helps to filter out short-term noise and provides a more accurate assessment of the underlying market conditions.
In summary, the 7-day moving average is a valuable tool for trend analysis and helps traders and investors make informed decisions based on the overall direction of the market. It is widely used in technical analysis and provides a reliable indicator of market sentiment.
Read Also: Steps to Becoming a Professional Forex Trader in Canada – Your Guide
There are several types of moving averages that traders and analysts use to track and analyze price trends in financial markets. Each type of moving average has its own characteristics and is used for different purposes. Here are some of the most commonly used types of moving averages:
Each type of moving average has its own advantages and disadvantages, and traders need to choose the one that best suits their trading strategy and analysis needs. It is common for traders to use multiple types of moving averages to get a more comprehensive view of price trends and market conditions.

A moving average is a calculation used to analyze data over a certain period of time by creating a series of averages of different subsets of the full data set.
A 7-day moving average is often used to smooth out short-term fluctuations in data and identify trends over a longer period of time.
To calculate a 7-day moving average, you need to sum the values of the data for the past 7 days and then divide it by 7.
Sure! Let’s say you have the following data for the past 7 days: 10, 15, 12, 18, 20, 17, 14. To calculate the 7-day moving average, you would add up these numbers (10 + 15 + 12 + 18 + 20 + 17 + 14 = 106) and then divide it by 7 (106 / 7 = 15.14). So, the 7-day moving average for this data set is 15.14.
A 7-day moving average is commonly used in financial analysis to track stock prices and identify trends. It can also be used in epidemiology to track the progression of diseases over time.
A moving average is a statistical calculation used to analyze data over a certain period of time. It helps to smooth out fluctuations and provide a clearer trend line. Moving averages are important because they can help identify trends and make predictions about future data points.
A 7-day moving average is a moving average that is calculated using the data from the past 7 days. To calculate the 7-day moving average, you need to add up the data points from the past 7 days and divide the sum by 7. This will give you the average value for that specific day.

Best Indicator to Use with Fractals Fractals are powerful tools in technical analysis that can help identify and confirm trends in financial markets. …
Read Article
Trading Cryptocurrency in Sweden: What You Need to Know In recent years, cryptocurrency has become a global phenomenon, attracting investors and …
Read Article
Combining RSI and Bollinger Bands: A Powerful Trading Strategy Technical analysis plays a crucial role in making informed trading decisions. One …
Read Article
Best Markets for Day Trading Day trading is a popular form of trading where traders buy and sell financial instruments within the same trading day. …
Read Article
Understanding a rolling spot forex transaction Foreign exchange trading, also known as Forex, is a decentralized global market where currencies are …
Read Article
Which economic indicator is the most important? Economic indicators play a crucial role in providing insights into the overall health of an economy. …
Read Article


