


Is Hedging Allowed in USA? Everything You Need to Know
Is Hedging Allowed in USA? When it comes to managing financial risk, one strategy that is often employed is hedging. Hedging involves taking a …
Read Article
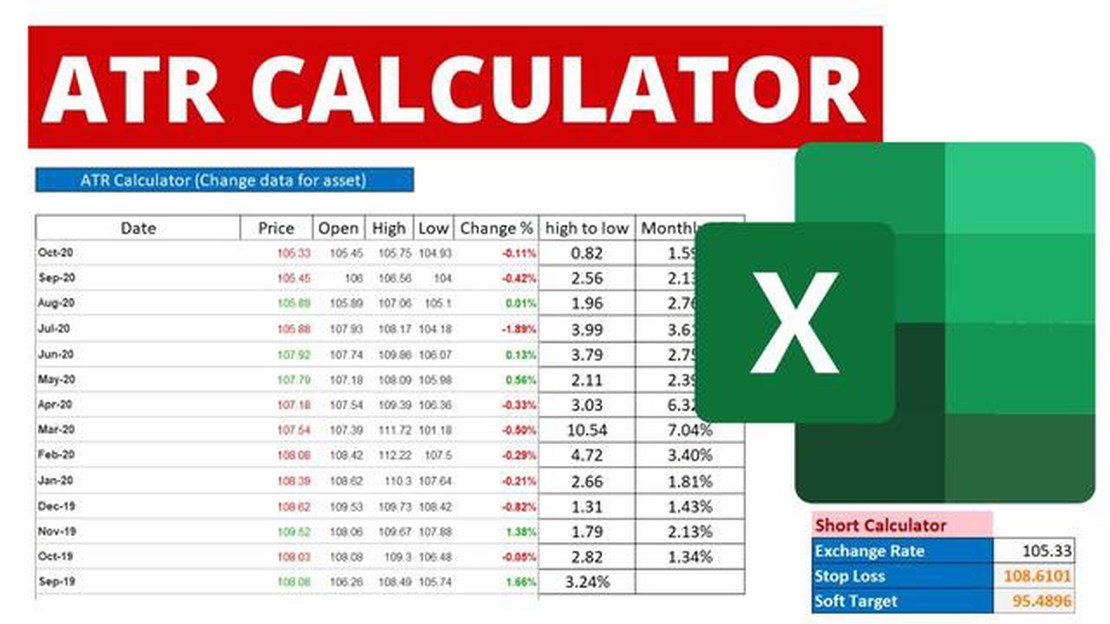
The Average True Range (ATR) is an essential technical analysis indicator that can help traders assess the level of volatility in a market. By understanding how to calculate ATR, traders can make more informed decisions about their trading strategies and risk management.
To calculate the ATR, you need to follow a few simple steps. First, you’ll need to gather the necessary data, including the high, low, and close prices for a specific period. This period can be adjusted based on your trading preferences, but a common choice is 14 periods.
Once you have the data, you can calculate the true range for each period. The true range is the greatest distance between any of the following: the high of the current period minus the low of the current period, the absolute value of the high of the current period minus the close of the previous period, or the absolute value of the low of the current period minus the close of the previous period.
After calculating the true range for each period, you can then calculate the average true range by taking the average of the true ranges over the specified period. This can be done by summing up all the true ranges and dividing the sum by the number of periods.

By having a clear understanding of how to calculate ATR, traders can gain valuable insights into market volatility and adjust their trading strategies accordingly. This can help them identify potential entry and exit points, as well as better manage their risk. Overall, ATR is a powerful tool that every trader should have in their toolkit.
When calculating the Average True Range (ATR), there are several key concepts that you need to understand. These concepts will help you accurately measure market volatility and determine the potential risk in a given security or market.
By understanding these key concepts, you will be able to calculate the ATR effectively and use it to make informed trading decisions. The ATR can help you identify potential breakout opportunities, set appropriate stop-loss levels, and manage your risk more effectively.
Read Also: How much does T24 cost? Find out the pricing of T24 here.
The Average True Range (ATR) is a technical indicator that helps traders to measure the volatility of a financial instrument. It was developed by J. Welles Wilder Jr. and introduced in his book “New Concepts in Technical Trading Systems” in 1978. The ATR is widely used by traders in various financial markets, including stocks, futures, and forex.
Volatility is an important concept in trading, as it indicates the amount of price movement that can be expected in a given period. Traders often use volatility as a guide to assess the potential risk and profit of a trade. The ATR provides a way to quantify volatility by measuring the average range between high and low prices over a certain number of periods.
The ATR is calculated using the true range, which is defined as the greatest of the following three values:
Once the true range is calculated for each period, the ATR is typically calculated as a moving average of the true range over a specified number of periods. The most common period used is 14, but traders can adjust this parameter based on their trading style and the timeframe they are analyzing.
The ATR is typically displayed as a line chart or as a histogram below the main price chart. It provides traders with a visual representation of volatility, allowing them to compare current volatility to historical levels and identify periods of high or low volatility.
Traders can use the ATR in various ways. One of the most common uses is as a tool for setting stop-loss orders and profit targets. By setting these parameters based on the ATR, traders can adjust them according to the current volatility of the market. Additionally, the ATR can be used to identify potential breakouts or reversals when volatility exceeds or drops below certain thresholds.
In conclusion, the Average True Range (ATR) is a valuable tool for traders to measure and analyze volatility in financial markets. By understanding and utilizing the ATR, traders can make more informed trading decisions and better manage their risk.
To calculate the Average True Range (ATR), you need to follow a step-by-step process. This indicator is commonly used in technical analysis to measure volatility in securities or market indices. By understanding how to calculate ATR, you can gain insights into the price movements and make better trading decisions. Here is a step-by-step guide on how to calculate ATR:
Read Also: Learn about Bollinger Bands in Ninjatrader 8: A Comprehensive Guide
By following these steps, you can accurately calculate the Average True Range (ATR) and use it as a tool to assess market volatility. This information can help you make more informed trading decisions and manage risk effectively.
Please note that there are various methods to calculate ATR, including different time periods for the moving average. It’s essential to adjust these parameters according to your trading strategy and the security or market index you are analyzing.
ATR stands for Average True Range.

ATR is important in trading as it helps traders gauge the volatility and potential price movement of a financial instrument. It can be used to determine stop-loss levels, set profit targets, and identify potential entry and exit points.
ATR is calculated by taking the average of the true range values over a specified period of time. The true range is the greatest of the following: the current high minus the current low, the absolute value of the current high minus the previous close, and the absolute value of the current low minus the previous close.
Yes, ATR can be used for all types of financial instruments, including stocks, forex, commodities, and indices. It is a versatile indicator that can be applied to any market.

Is Hedging Allowed in USA? When it comes to managing financial risk, one strategy that is often employed is hedging. Hedging involves taking a …
Read Article
Superannuation Funds: Exploring Your Options Planning for your retirement is essential, and one of the key aspects of this is choosing the right …
Read Article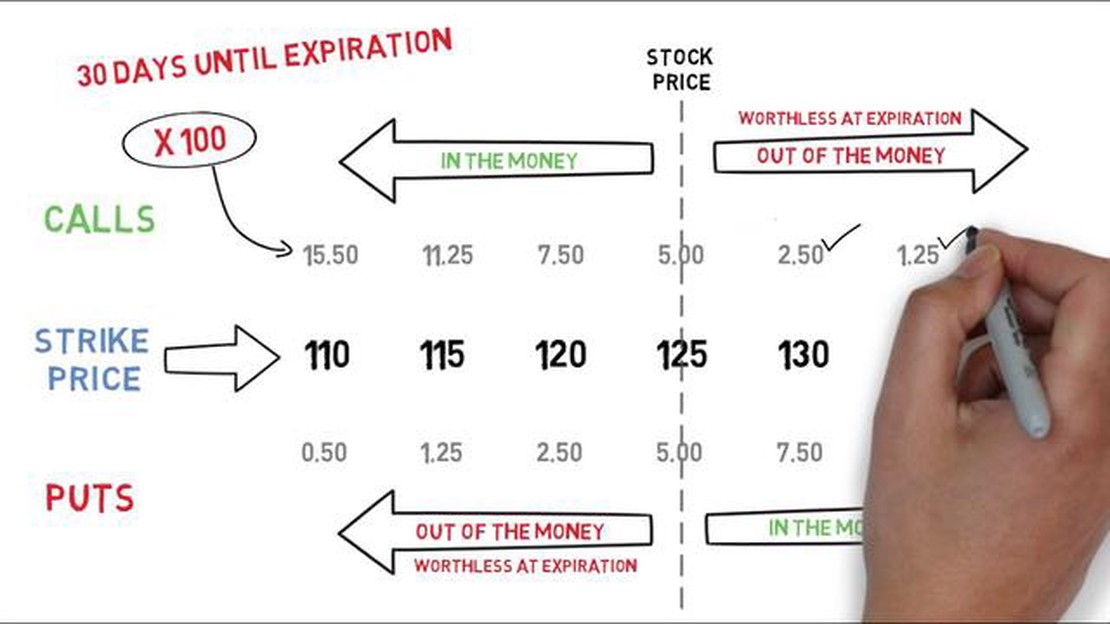
How many shares can you buy with options? Options trading can be an exciting and potentially lucrative investment strategy. It allows traders to …
Read Article
Impact of September 11, 2001 Attacks on the Stock Market The stock market crash that occurred on September 11, 2001, sent shockwaves around the world …
Read Article
Convert $500 USD to EGP Are you planning a trip to Egypt and wondering how much $500 USD is in Egyptian pounds (EGP)? Look no further! In this …
Read Article
How to Measure Trade Performance In today’s globalized economy, trade plays a crucial role in the growth and development of nations. As businesses and …
Read Article


