


What is the value of a micro lot in forex trading?
What is the value of a micro lot? Forex trading is a popular way for individuals to engage in the global currency market and potentially earn profits. …
Read Article
How to Calculate a 5 Quarter MovingWhat is a 5 Quarter Moving Average?A 5 quarter moving average is a statistical calculation that helps to smooth out fluctuations in data over a 5 quarter period. It is commonly used in financial analysis to identify trends and patterns in data, especially in relation to sales, revenues, or costs.The 5 quarter moving average is calculated by taking the average of the data points from the current quarter and the four preceding quarters. This provides a rolling average that reflects the overall direction of the data over time.By using a moving average, analysts can better understand the underlying trends in the data and identify potential patterns or anomalies. It can help to filter out short-term fluctuations or seasonal variations, allowing for a clearer analysis of the long-term trend.The 5 quarter moving average is often used in forecasting models, as it provides a smoothed estimate of future values based on past performance. It can be particularly useful in predicting future sales or revenues, as it takes into account both recent and historical data.Overall, the 5 quarter moving average is a valuable tool in data analysis and forecasting. It provides a clearer picture of the underlying trends in data, helping analysts make more informed decisions and predictions.Why is it Important?Calculating a 5 quarter moving average can be a valuable tool for businesses and investors to analyze and understand trends in data over time. It is especially useful for identifying long-term patterns and smoothing out short-term fluctuations in data.Here are some reasons why calculating a 5 quarter moving average can be important:
| 1. Trend Analysis | By calculating a moving average, you can identify the overall trend in the data. This can help you make informed decisions about future investments, business strategies, and market trends. |
| 2. Eliminate Noise | A moving average can help filter out short-term fluctuations or noise in the data. This is especially useful when there are random or irregular patterns that may obscure the underlying trend. |
| 3. Forecasting | Using a 5 quarter moving average can provide a smoother representation of the data, making it easier to predict future values and trends. It can also help identify potential turning points or periods of acceleration or deceleration. |
| 4. Identifying Seasonal Patterns | A moving average can reveal seasonal patterns or cycles within the data. This can be useful for businesses that experience regular fluctuations in demand or sales volume throughout the year. |
| 5. Data Visualization | Presenting data using moving averages can make it easier to visualize and interpret. This can be especially helpful when presenting data to stakeholders, investors, or clients who may not be familiar with the raw data or complex statistical measures. |
Overall, calculating a 5 quarter moving average provides a way to analyze data in a meaningful and practical manner. It helps to identify trends, eliminate noise, forecast future values, and understand underlying patterns. By using this technique, businesses and investors can make more informed decisions and gain a deeper understanding of their data.Step-by-Step Guide1. Gather the data for the time period you want to calculate the moving average for. This data should be organized in quarterly intervals. 2. Add the values of the five quarters together. 3. Divide the sum by 5 to calculate the average. 4. Repeat the process for each subsequent set of five quarters until you have reached the end of the time period. 5. Record the moving averages you calculate for each set of five quarters. 6. Plot the moving averages on a graph to visualize the trend.
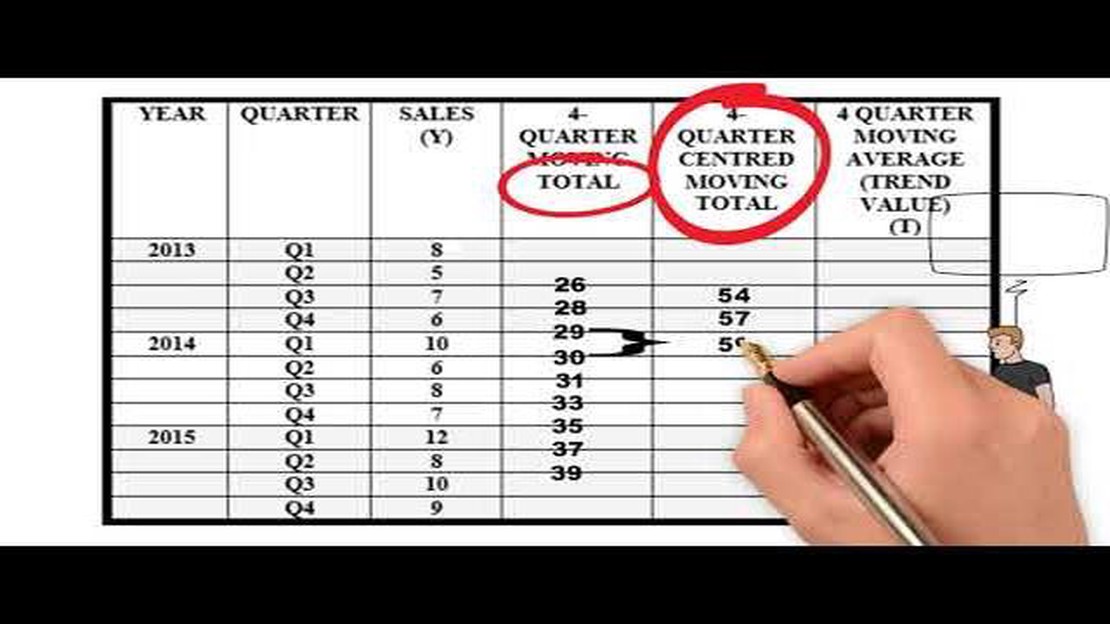
Calculating a 5 quarter moving average allows you to smooth out variations in data over time and identify longer-term trends. It can be useful in analyzing financial or economic data and making predictions based on historical patterns. By following this step-by-step guide, you can easily calculate a moving average and gain valuable insights from your data.Step 1: Collect the DataTo calculate a 5 quarter moving average, the first step is to collect the data. The data should be obtained for the specific variable or parameter you want to analyze over time. This could be anything from sales figures, stock prices, or any other time-series data that you want to evaluate.Ensure that you have a sufficient amount of data for at least 5 quarters. The more data you have, the more accurate your moving average will be. It is recommended to use a minimum of 20 data points to calculate the moving average effectively.Make sure that the data is in chronological order, with the most recent data point being at the end. This is essential for calculating the moving average correctly and obtaining meaningful results.Once you have collected the required data, you are ready to move on to the next step of calculating the 5 quarter moving average.Step 2: Calculate the Moving AveragesAfter collecting the data for the five quarters, the next step is to calculate the moving averages. The moving average is a statistical technique that helps smoothen out fluctuations in data over a given period of time. In this case, we will be calculating a 5-quarter moving average.To calculate the moving average, you need to sum up the values for each quarter within the moving average period and then divide the sum by the number of quarters. The result will be the moving average value for that particular quarter.For example, let’s say we have the following quarterly sales data:
| Quarter | Sales |
|---|---|
| Q1 | 100 |
| Q2 | 150 |
| Q3 | 200 |
| Q4 | 120 |
| Q5 | 180 |

What is the value of a micro lot? Forex trading is a popular way for individuals to engage in the global currency market and potentially earn profits. …
Read Article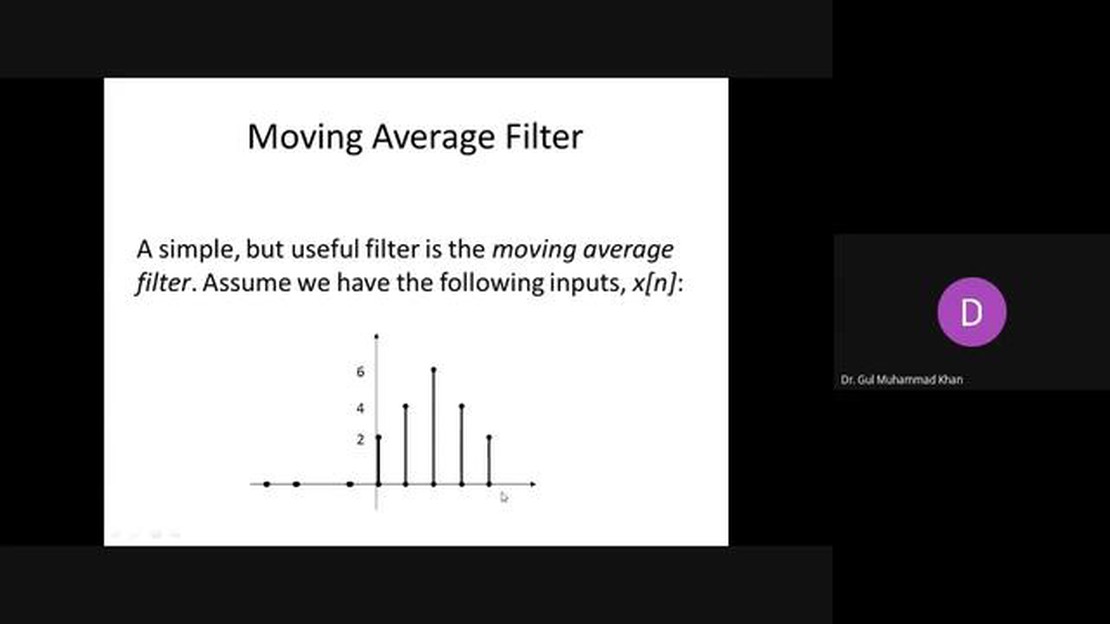
Impulse response of the moving average system When it comes to analyzing and understanding signals in various fields, the impulse response of a system …
Read Article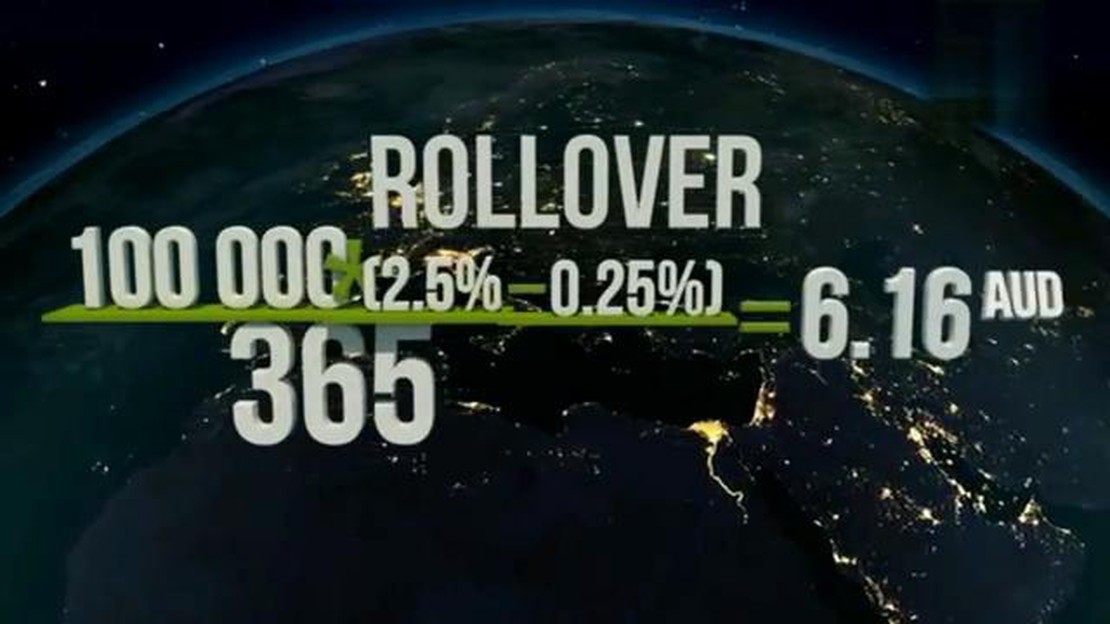
Understanding a rolling spot forex transaction Foreign exchange trading, also known as Forex, is a decentralized global market where currencies are …
Read Article
Is Donchian Channel Profitable? When it comes to trading in the financial markets, it’s important to have a strategy that can provide consistent …
Read Article
Understanding the High Costs of PSA Grading PSA grading, also known as Professional Sports Authenticator grading, has become a highly sought-after …
Read Article
Should You Buy or Sell Canadian Solar Stock? Canadian Solar is a leading manufacturer and provider of solar fotovoltaic modules and an investor in …
Read Article


