


USD to EGP 1000: Current Exchange Rate and Conversion Calculator
Exchange rate: USD to EGP 1000 If you are planning on traveling to Egypt or doing business with Egyptian partners, it is crucial to stay up-to-date …
Read Article
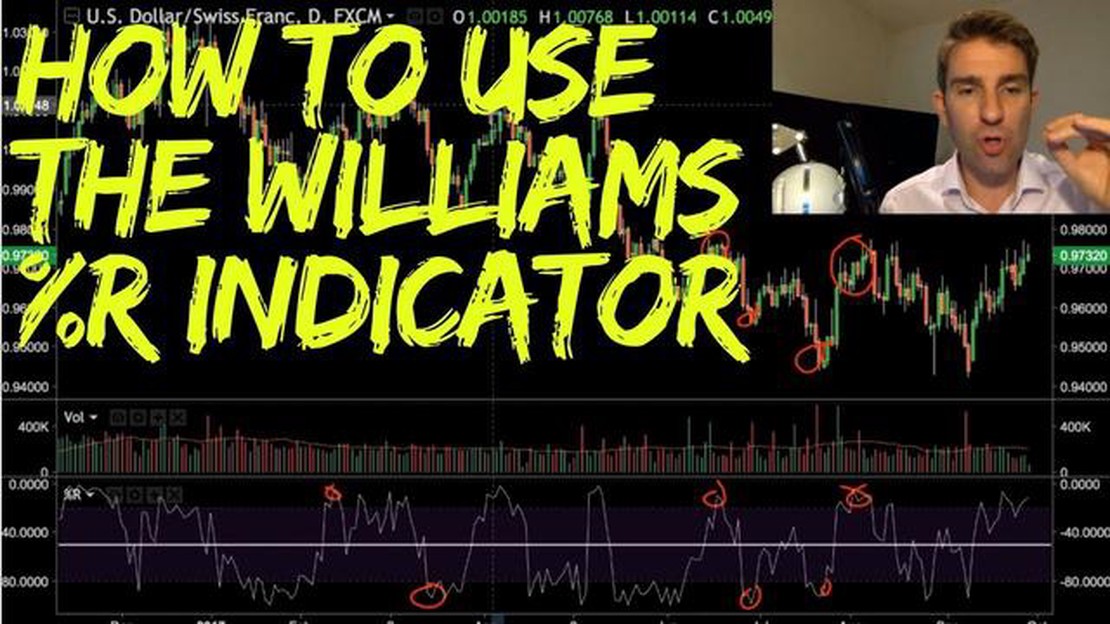
When it comes to trading and investing, having the right tools and indicators is essential. One popular and widely used indicator is the Williams %R Indicator. Developed by Larry Williams, this technical analysis tool is used to identify potential overbought or oversold conditions in a stock or asset.
The Williams %R Indicator is a momentum oscillator that measures the level of a stock or asset’s close relative to the high-low range over a certain period of time. It ranges from 0 to -100, with readings above -20 indicating overbought conditions and readings below -80 indicating oversold conditions.
Traders and investors can utilize the Williams %R Indicator to identify potential trend reversals and to confirm the strength of an existing trend. This indicator can be used in conjunction with other technical analysis tools, such as moving averages or volume indicators, to improve accuracy and generate more reliable trading signals.
While the Williams %R Indicator can be a valuable tool, it is important for traders and investors to understand its limitations and to use it in conjunction with other indicators and analysis methods. Like any other technical analysis tool, the Williams %R Indicator is not foolproof and can produce false signals. It is crucial to have a comprehensive trading strategy and to combine multiple indicators for a more comprehensive analysis of the market.
The Williams %R indicator, also known as Williams Percent Range, is a popular technical analysis tool used by traders and investors to identify overbought and oversold conditions in the market.
The indicator was developed by Larry Williams and is based on the concept of momentum. It measures the level of recent price relative to the high-low range over a specified period of time. The Williams %R indicator is displayed as a negative value ranging from 0 to -100.
When the Williams %R indicator is above -20, it indicates that the market is in overbought territory, and there is a higher likelihood of a price reversal or correction. Conversely, when the indicator is below -80, it suggests that the market is oversold, and there is a higher chance of a price rebound or reversal in the upward direction.

The Williams %R indicator is often used in conjunction with other technical analysis tools, such as moving averages, to confirm trade signals. Traders and investors can use the indicator to identify potential entry and exit points in the market.
For example, if the Williams %R indicator is above -20 and the price is near a resistance level, it could be a signal to sell or short the security. On the other hand, if the indicator is below -80 and the price is near a support level, it could be a signal to buy or go long on the security.
It is important to note that the Williams %R indicator is a momentum oscillator and can give false signals in range-bound markets. Therefore, it is essential to use the indicator in conjunction with other technical analysis tools and confirm signals before making trading decisions.
In conclusion, the Williams %R indicator is a valuable tool for traders and investors to identify overbought and oversold conditions in the market. It provides insights into potential price reversals and can be used to make informed trading decisions. However, like any technical analysis tool, it should not be used in isolation and should be used in conjunction with other indicators and analysis techniques.
| Pros | Cons |
|---|---|
| - Provides clear signals for overbought and oversold conditions | - Can give false signals in range-bound markets |
| - Can be used in conjunction with other technical analysis tools | - Should not be used as the sole basis for trading decisions |
| - Helps identify potential entry and exit points |
Read Also: How much is $500 USD in EGP? Find out the latest exchange rate!
The Williams %R Indicator, also known as the Williams Percent Range Indicator, is a popular technical analysis tool used by traders and investors to identify overbought and oversold conditions in the market. It was developed by Larry Williams and is commonly used as a momentum oscillator.
The Williams %R Indicator measures the level of the current closing price relative to the highest high and lowest low over a specified period of time. It is displayed as a line that fluctuates between 0 and -100, with readings below -20 typically considered as oversold and readings above -80 as overbought.
The Williams %R Indicator is calculated using the following formula:
Williams %R = (Highest High - Close) / (Highest High - Lowest Low) * -100
Read Also: Understanding the Difference: Phantom Stock Options vs Employee Stock Option Plans (ESOP)
Traders and investors use the Williams %R Indicator to determine when a security is overbought or oversold and may be due for a reversal. When the indicator is in the oversold zone, it suggests that the price has fallen too far and may soon rebound. Conversely, when the indicator is in the overbought zone, it indicates that the price has risen too high and may be poised for a decline.
It is important to note that the Williams %R Indicator should not be used in isolation and should be used in conjunction with other technical indicators and analysis tools to confirm signals and make more informed trading decisions.
In conclusion, the Williams %R Indicator is a powerful tool for identifying overbought and oversold conditions in the market. By using this indicator in combination with other tools, traders and investors can gain valuable insights into the potential direction of a security’s price movement.
The Williams %R indicator is a technical analysis tool that helps traders and investors identify overbought or oversold conditions in a market.
The Williams %R indicator is calculated by taking the highest high of a certain period, subtracting the current closing price, and dividing it by the difference between the highest high and the lowest low of the same period.

The Williams %R indicator ranges from 0 to -100.
Traders can use the Williams %R indicator to identify potential buy or sell signals. When the indicator is above -20, it is considered overbought, and when it is below -80, it is considered oversold.
Yes, the Williams %R indicator can be used for different timeframes, such as daily, weekly, or monthly. The choice of timeframe depends on the trader’s trading style and investment horizon.
The Williams %R Indicator is a technical analysis tool used by traders and investors to measure the overbought or oversold condition of an asset. It was developed by Larry Williams in 1973 and is based on the concept of normalized prices within a given period. The indicator oscillates between 0 and -100, with values above -20 considered overbought and values below -80 considered oversold.
The Williams %R Indicator is calculated by subtracting the highest high over a given period from the current closing price and dividing it by the difference between the highest high and the lowest low over the same period. The result is then multiplied by -100 to obtain a percentage value. The formula for calculating the Williams %R Indicator is: %R = (H - C) / (H - L) * 100, where H is the highest high, C is the current closing price, and L is the lowest low over the chosen period.

Exchange rate: USD to EGP 1000 If you are planning on traveling to Egypt or doing business with Egyptian partners, it is crucial to stay up-to-date …
Read Article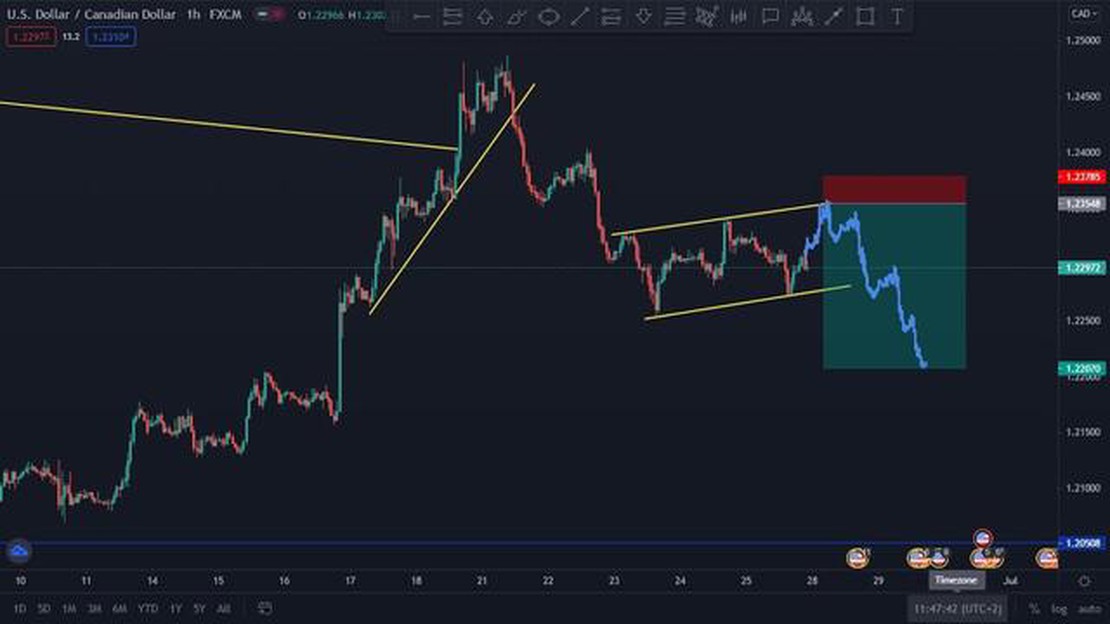
How to Create a Forex Signal: A Step-by-Step Guide Forex trading is a popular investment option that allows traders to earn profits by speculating on …
Read Article
What is the Mesa Adaptive Moving Average? The Mesa Adaptive Moving Average (MAMA) is a technical indicator used in financial markets to smooth out …
Read Article
Understanding the Mechanics of the 1000Pip Climber System Are you tired of the ups and downs in your forex trading? Do you want a reliable system that …
Read Article
Exploring the Distinction between Whole Loan Sale and Securitization When it comes to the world of finance, there are various ways in which loans can …
Read Article
Options Trading in TFSA: Everything You Need to Know Options trading can be a lucrative investment strategy for those looking to maximize their …
Read Article

