


Who can trade in F&: A Guide for Traders
Who can trade in F&? If you are interested in trading, it is important to know who can participate in the F& market. The F& market is open to both …
Read Article
Skewness is a statistical concept that measures the asymmetry of a distribution. When a distribution is skewed, it means that the data points are not evenly distributed around the mean, and there is an imbalance towards one tail of the distribution. Skewness is an important concept in statistics and can provide valuable insights into the characteristics of a dataset.
Positive skewness, also known as right-skewness, occurs when the tail of the distribution is longer on the right side. This indicates that there are some extreme values in the dataset that pull the mean towards the right. Understanding positive skewness can help us identify and analyze situations where there are outliers or extreme values that significantly impact the overall distribution.
One example of positive skewness can be found in analyzing income data. In many societies, there is a significant income disparity, with a few individuals earning extremely high incomes while the majority of people earn lower incomes. As a result, the income distribution is often positively skewed, as the extreme high incomes push the mean towards the higher end of the income spectrum.
For instance, consider a dataset of household incomes in a country. The majority of households may have low to moderate incomes, while a small fraction of households may have very high incomes. The income distribution may be positively skewed, with the mean income higher than the median income due to the presence of these extreme high-income households.
In conclusion, understanding positive skewness is crucial when analyzing datasets as it provides insights into the distribution’s shape and the presence of outliers or extreme values. By recognizing and studying positive skewness, statisticians and researchers can better understand the characteristics of a dataset and make more informed decisions based on their analysis.

Skewness is a statistical concept that measures the asymmetry of a probability distribution. It tells us whether the data is concentrated more on one side of the distribution compared to the other side. It is an essential tool in statistics and provides valuable insights into the shape of a dataset.
Skewness is used to characterize the direction and extent of skew present in a dataset. Skewness can be positive, negative, or zero, indicating the tail’s direction and the degree of symmetry of the distribution.
Positive skewness occurs when the tail on the right side of the distribution is longer or fatter than the left side. This means that the majority of the data points are concentrated on the left side of the distribution, while a few extreme values are present on the right side.
On the other hand, negative skewness occurs when the tail on the left side of the distribution is longer or fatter than the right side. In this case, the majority of the data points are concentrated on the right side, while a few extreme values are present on the left side.
A skewness value of zero indicates a perfectly symmetric distribution, where the left and right sides are equally balanced. However, it’s important to note that zero skewness doesn’t necessarily mean the distribution is normal.
Read Also: How to Choose the Best Moving Average Period
Skewness is an important statistical concept as it helps us understand the shape and characteristics of a distribution. It is widely used in fields such as finance, economics, and social sciences to analyze and interpret data. By examining the skewness of a dataset, we can gain valuable insights into its underlying properties and make more informed decisions.
Skewness is a fundamental concept in statistics that measures the asymmetry of a probability distribution. When a distribution is skewed, it means that the data points are not symmetrically distributed around the mean.
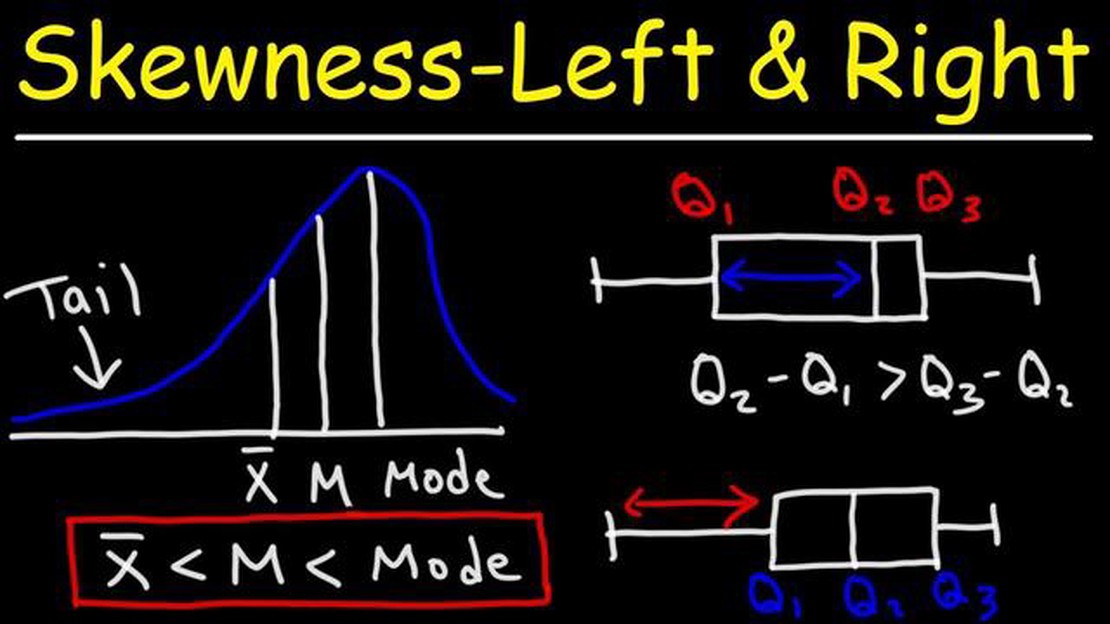
Positive skewness (or right-skewness) is a type of skewness where the tail of the distribution extends towards the right-hand side. In other words, when there is positive skewness, the majority of data points are concentrated towards the lower end of the distribution, while a few extreme values extend towards the higher end.
To visualize positive skewness, imagine a histogram of data with a long tail on the right side. The mean is typically larger than the median in a positively skewed distribution, as the tail on the right pulls the mean towards higher values.
Read Also: Can market orders be restricted for stock options due to lack of liquidity?
Positive skewness may occur in various scenarios. For example, in a dataset of household incomes, where most households have relatively low incomes, but a few households have extremely high incomes, the distribution of incomes would likely exhibit positive skewness.
Understanding positive skewness is important because it can impact data analysis and decision-making processes. When dealing with positively skewed data, it is essential to consider appropriate statistical measures and techniques that take into account the presence of outliers and the asymmetry of the distribution. Additionally, positive skewness can have implications in fields such as finance, economics, and social sciences.
Positive skewness is a statistical concept that indicates an asymmetrical distribution of data, where the tail of the distribution is longer on the right side. This means that the majority of the data is concentrated on the left side of the distribution, and there are few extreme values on the right side.
Positive skewness can affect data analysis by distorting the mean, making it higher than the median. This can give a skewed perception of the central tendency of the data. Additionally, positive skewness may indicate outliers or extreme values in the data that can have a significant impact on the overall analysis.
Real-world examples of positive skewness include the distribution of income, where the majority of people fall into lower income brackets, but there are a few individuals with extremely high incomes. Another example is the distribution of exam scores, where most students score around the average, but there are a few students who achieve exceptionally high scores.

Positive skewness can be identified in a data set by examining the shape of the distribution. If the tail of the distribution is longer on the right side, it indicates positive skewness. Additionally, measures such as skewness coefficient or skewness test can be used to quantify the degree of skewness in the data set.
Positive skewness in data analysis can have implications for hypothesis testing and statistical modeling. It is important to consider the potential impact of outliers or extreme values on the results and to use appropriate statistical techniques that account for the skewness. Additionally, understanding positive skewness can help to interpret and communicate data in a more accurate and meaningful way.
Positive skewness is a statistical concept that represents the asymmetry of a distribution in which the tail on the right side is longer or fatter than the tail on the left side. This indicates that the majority of the data points in the distribution are concentrated on the left side, and there are few extreme values on the right side.

Who can trade in F&? If you are interested in trading, it is important to know who can participate in the F& market. The F& market is open to both …
Read Article
What is the Best Algorithm for Anomaly Detection? Anomaly detection plays a crucial role in various industries, from finance to cybersecurity. …
Read Article
Forex Trading during the London Open hour The London open is a crucial time for forex traders around the world. As one of the major financial centers, …
Read Article
Can the average speed of a moving object be zero? The concept of average speed is a fundamental concept in physics and motion. It is calculated by …
Read Article
How much is Baghdad dinar in USD? The exchange rate between the Baghdad Dinar and the United States Dollar (USD) is an important topic for those …
Read Article
Understanding the 1 2 3 Rule in Trading Trading in the financial markets can be a complex and unpredictable endeavor. As an investor, it is essential …
Read Article


