


Understanding the Significance of MAT in Business
What Does Mat Mean in Business? Management Aptitude Test, commonly known as MAT, is an essential tool that helps businesses assess the potential of …
Read Article
The ADX (Average Directional Index) Indicator is a powerful technical tool used in the analysis of financial markets. Developed by J. Welles Wilder Jr., the ADX Indicator helps traders identify the strength and direction of a trend, making it an essential tool for both beginner and experienced traders in the Forex and stock markets.
The ADX Indicator is especially useful when it comes to trend trading strategies. By measuring the strength of a trend, it helps traders determine whether to enter a position, hold on to an existing trade, or exit a trade. The ADX Indicator is displayed as a line on a chart and ranges from 0 to 100. A reading below 20 suggests a weak trend, while a reading above 40 indicates a strong trend.
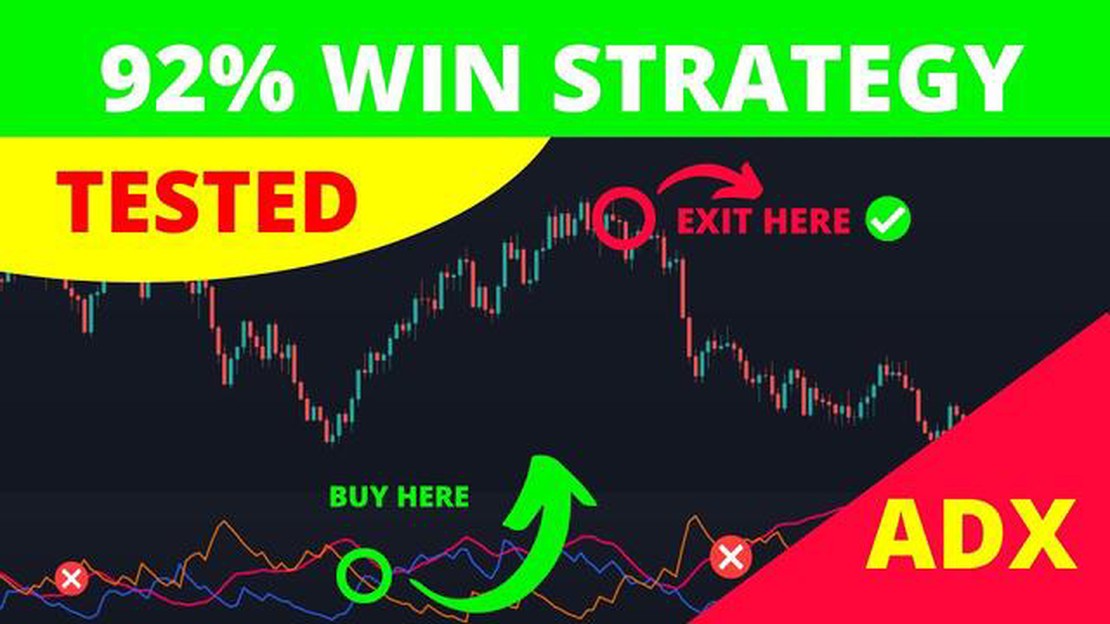
To effectively use the ADX Indicator, traders must understand its three components - the ADX line, the +DI line, and the -DI line. The ADX line represents the strength of a trend, while the +DI line measures the bullish force and the -DI line measures the bearish force. When the +DI line crosses above the -DI line, it suggests a bullish trend, and when the -DI line crosses above the +DI line, it indicates a bearish trend.
When using the ADX Indicator, traders should also be aware of other technical tools and indicators that can complement their analysis. This includes using support and resistance levels, moving averages, and other oscillators to validate the signals provided by the ADX Indicator. By combining different tools and indicators, traders can increase their chances of making profitable trades in the market.
In conclusion, the ADX Indicator is a valuable tool for traders looking to identify and capitalize on trends in the financial markets. By understanding its components and using it in conjunction with other technical analysis tools, traders can gain a deeper insight into the strength and direction of trends, ultimately improving their trading decisions and profitability.
The Average Directional Index (ADX) is a technical indicator used in financial markets, including the MT5 platform, to determine the strength of a market trend. It was developed by J. Welles Wilder and is widely used by traders and analysts.
The ADX indicator provides information about the strength of a trend, but not the direction. It measures the strength of both bullish and bearish trends, as well as the strength of a range-bound market. This makes it a versatile tool for traders who want to identify trend strength and potential trend reversals.
The ADX indicator consists of three lines: the ADX line, the +DI line, and the -DI line. The ADX line represents the strength of the overall trend, while the +DI line represents the bullish trend and the -DI line represents the bearish trend. The ADX line is plotted on a scale from 0 to 100, with values above 25 indicating a strong trend.
Traders can use the ADX indicator to determine when a market is trending and when it is in a range. A high ADX value indicates a trending market, while a low ADX value suggests a range-bound market. Traders can also use the +DI and -DI lines to identify potential trend reversals or confirm trend signals.

The ADX indicator can be used in various trading strategies, such as trend-following strategies, trend reversal strategies, and range-bound strategies. It can be used in combination with other technical indicators and chart patterns to enhance trading decisions.
Read Also: How Much Is 0.01 Lot? Explained | Learn Forex Trading Basics
Overall, the ADX indicator is a valuable tool for traders to assess the strength of a market trend and make informed trading decisions. It is widely used in technical analysis and can be utilized in different market conditions.
The Average Directional Index (ADX) is a popular technical indicator used in trading to help identify the strength and direction of a trend. It was developed by J. Welles Wilder and is calculated based on the price movements of an asset over a specified period of time.
The ADX indicator consists of three lines: the ADX line, the +DI line, and the -DI line. The ADX line represents the overall strength of the trend, while the +DI line measures the strength of a positive trend, and the -DI line measures the strength of a negative trend.
Traders can use the ADX indicator to determine when a market is trending or ranging. When the ADX line is above a certain threshold, usually 25 or 30, it indicates that a market is trending. On the other hand, when the ADX line is below the threshold, it suggests that a market is ranging and it may not be a good time to enter a trade.
Another important aspect of the ADX indicator is the direction of the trend. When the +DI line is above the -DI line, it suggests a bullish trend, indicating that buyers have control of the market. Conversely, when the -DI line is above the +DI line, it suggests a bearish trend, indicating that sellers have control of the market.
It is also important to understand that the ADX indicator does not provide buy or sell signals. Instead, it helps traders confirm the presence of a trend and determine its strength. Traders can then use other technical indicators or trading strategies to enter and exit trades.
In conclusion, the ADX indicator is a valuable tool for traders to analyze the strength and direction of a trend. By understanding the basics of how it works, traders can make more informed trading decisions and improve their chances of success in the market.
The Average Directional Index (ADX) is a popular technical indicator used in the financial markets, including the MetaTrader 5 (MT5) trading platform. The ADX indicator is primarily used to determine the strength and direction of a trend. It consists of three lines: the ADX line, the positive directional indicator (+DI) line, and the negative directional indicator (-DI) line.
Read Also: Understanding Stock Options in Salary: Unleashing the Potential of Employee Compensation
Here is a step-by-step guide on how to use the ADX indicator in MT5:

Remember that the ADX indicator is not a standalone indicator and should be used as part of a comprehensive trading strategy. It is also important to practice proper risk management and consider other factors such as market conditions and fundamental analysis when making trading decisions.
In conclusion, the ADX indicator is a valuable tool for traders to assess the strength and direction of a trend. By understanding how to use this indicator in the MT5 trading platform, traders can enhance their technical analysis and potentially improve their trading outcomes.
The ADX indicator, short for Average Directional Index, is a technical analysis tool that is used to measure the strength and direction of a trend in financial markets.
The ADX indicator is calculated based on the difference between two other indicators: the +DI (Positive Directional Index) and the -DI (Negative Directional Index). The ADX value is obtained by calculating the difference between the two directional indicator values and normalizing it.
The ADX indicator provides information about the strength and direction of a trend. A higher ADX value indicates a stronger trend, while a lower ADX value indicates a weaker trend. The ADX value can range from 0 to 100.
The ADX indicator can be used in various ways in a trading strategy. One common method is to use it as a filter to confirm the presence of a strong trend before entering a trade. Traders can also use the ADX indicator to determine when a trend is losing strength and may be coming to an end.
Like any technical analysis tool, the ADX indicator has its limitations. It is most effective in trending markets and may give false signals in sideways or choppy markets. It is also not suitable for predicting trend reversals. Traders should use the ADX indicator in conjunction with other tools to increase its effectiveness.
The ADX indicator, or Average Directional Index, is a technical analysis tool used to measure the strength and direction of a trend in a financial market.

What Does Mat Mean in Business? Management Aptitude Test, commonly known as MAT, is an essential tool that helps businesses assess the potential of …
Read Article
Developing an Effective Options Trading Strategy Options trading can be a lucrative and exciting form of investment, but it requires a …
Read Article
Is BCA accepted in USA? BCA (Bachelor of Computer Applications) is a popular undergraduate degree program in the field of computer science. It equips …
Read Article
Easy Steps to Understand Forex Trading Forex trading, also known as foreign exchange trading, is the largest and most liquid financial market in the …
Read Article
Where to Withdraw Pounds at Danske Bank Are you a Danske Bank customer and need to withdraw British pounds? You’re in the right place! Danske Bank …
Read Article
Will Robinhood offer futures trading? Robinhood, the popular commission-free trading platform, has become a favorite among young investors looking to …
Read Article


