Why Do Private Equity Firms Perform Leveraged Buyouts (LBOs)?
Reasons Why Private Equity Firms Engage in Leveraged Buyouts Private equity firms are known for their unique approach to investing, often implementing …
Read Article
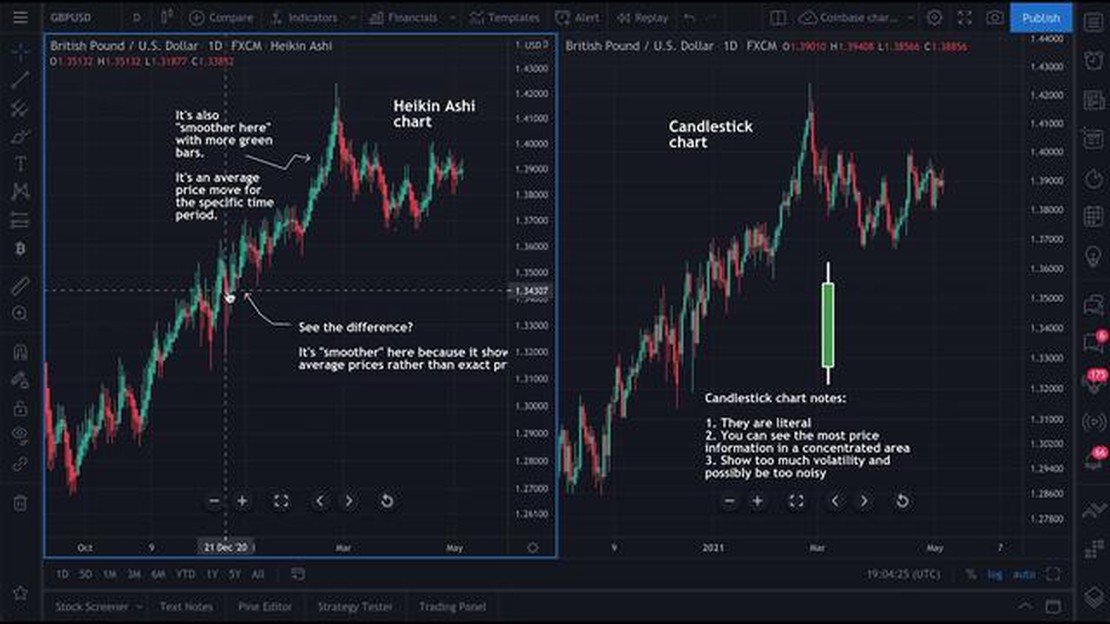
When it comes to analyzing market trends and making informed trading decisions, the use of technical analysis tools is crucial. Two popular methods that traders often rely on are Heiken Ashi and Japanese Candlestick patterns. Both methods provide valuable insights into price movements and can help predict future market tendencies. However, it is essential to understand the fundamental differences between these methods and determine which one is more suitable for your trading strategy.
Japanese Candlestick patterns have been used in trading for centuries and are based on the concept of support and resistance levels. These patterns consist of a series of candlestick shapes and formations that indicate potential price reversals or continuations. Traders analyze the open, close, high, and low prices of each candlestick to identify patterns such as bullish engulfing, shooting star, or doji. The interpretation of these patterns can provide insights into market sentiment and potential price movements.
On the other hand, Heiken Ashi charts are a more recent invention that aims to filter out market noise and provide a smoother representation of price movements. Heiken Ashi candles are calculated based on average price values and are color-coded to indicate whether the market is in an uptrend or downtrend. These charts are especially helpful for trend identification and long-term trading strategies. By removing the noise and emphasizing the overall trend, Heiken Ashi charts can offer a more comprehensive view of the market compared to traditional candlestick charts.
Ultimately, the choice between Heiken Ashi and Japanese Candlestick patterns depends on your trading style and goals. If you are an active trader who relies on short-term price movements and precise entry and exit points, Japanese Candlestick patterns may be more suitable for your needs. On the other hand, if you prefer a broader view of market trends and want to filter out market noise, Heiken Ashi charts can provide a more accurate representation of price movements. It is crucial to experiment with both methods and determine which one aligns better with your trading strategy and risk tolerance.
Remember, there is no one-size-fits-all solution in trading, and different tools work for different traders. Both Heiken Ashi and Japanese Candlestick patterns have proven to be effective in their respective contexts, and it is up to you to decide which one works best for your trading style.
Advantages:
 2. Trend identification: Heiken Ashi candles make it easier to identify trends compared to traditional Japanese candlestick patterns. The colors of the Heiken Ashi candles change based on the direction of the trend, making it visually clear for traders to recognize the prevailing market sentiment.
3. Elimination of price gaps: Heiken Ashi charts eliminate price gaps that may occur due to market factors such as news announcements or market opening/closing. This makes the Heiken Ashi charts more suitable for trend analysis and removes some of the market noise.
Read Also: Choosing the Right Time Frame for Trading: A Comprehensive Guide4. Reduced trading stress: Heiken Ashi charts can help reduce the emotional stress associated with trading. Their smooth nature and trend-focused approach can provide traders with a more relaxed trading experience, as they don’t have to constantly analyze individual candlestick patterns. 5. Clearer support and resistance levels: Heiken Ashi charts can provide clearer support and resistance levels compared to traditional candlestick charts. The smoothing effect of Heiken Ashi candles makes it easier to identify key levels and trade based on them.
Disadvantages:
Read Also: The Difference Between Weighted Moving Average and Simple Moving Average Explained4. Less widely used: Traditional candlestick charts are more widely used and recognized among traders and analysts. This may result in less availability of educational resources and field expertise specifically focused on Heiken Ashi analysis.
Japanese candlestick patterns have been used for centuries to analyze and predict market trends. Here are a few advantages and disadvantages to consider when using Japanese candlestick patterns in your trading strategy:
Understanding the advantages and disadvantages of Japanese candlestick patterns can help you make better-informed trading decisions and enhance the effectiveness of your trading strategy.
Heiken Ashi and Japanese Candlestick Patterns are two different types of charting techniques used in technical analysis to analyze price movements in financial markets. Heiken Ashi is a modified version of traditional Japanese Candlestick Patterns that helps to filter out market noise and provides a smoother visual representation of price trends.
The choice between Heiken Ashi and Japanese Candlestick Patterns depends on individual preferences and trading strategies. Heiken Ashi is useful for traders who want to focus on the overall trend and reduce noise in price movements. Japanese Candlestick Patterns provide more detailed information about market sentiment and can assist in identifying potential reversals or continuation patterns.
Yes, there are some advantages of using Heiken Ashi over Japanese Candlestick Patterns. Heiken Ashi smoothes out price data, making it easier to identify trends and avoid false signals. It also provides clearer signals for entry and exit points, which can be beneficial for traders who prefer a more mechanical trading approach.
Yes, Japanese Candlestick Patterns can be used in conjunction with Heiken Ashi. Some traders prefer to use Heiken Ashi for overall trend analysis and then switch to Japanese Candlestick Patterns for more detailed entry and exit signals. Combining these two techniques can provide a more comprehensive view of price movements and improve trading accuracy.
Reasons Why Private Equity Firms Engage in Leveraged Buyouts Private equity firms are known for their unique approach to investing, often implementing …
Read ArticleBeginner’s Guide to Aggressive Investing Strategies Investing aggressively is a strategy that can potentially yield high returns and help you grow …
Read ArticleWhat is the full form of XAUUSD? XAUUSD is the ticker symbol used in the financial market to represent the exchange rate between gold and the United …
Read ArticleWhen to Start Trading Forex: Tips and Guidelines Forex trading, also known as foreign exchange trading, is a highly popular and potentially profitable …
Read ArticleWhat is the Best Indicator for RSI? RSI (Relative Strength Index) is a popular technical analysis tool used by traders to identify potential market …
Read ArticleHow Many Monitors Do You Need for Forex Trading? When it comes to forex trading, having the right tools and equipment can make a significant …
Read Article