


How to Easily Find Your Bank Code in Singapore
How to Find Your Bank Code in Singapore When it comes to banking in Singapore, knowing your bank code is essential. Your bank code is a unique …
Read Article
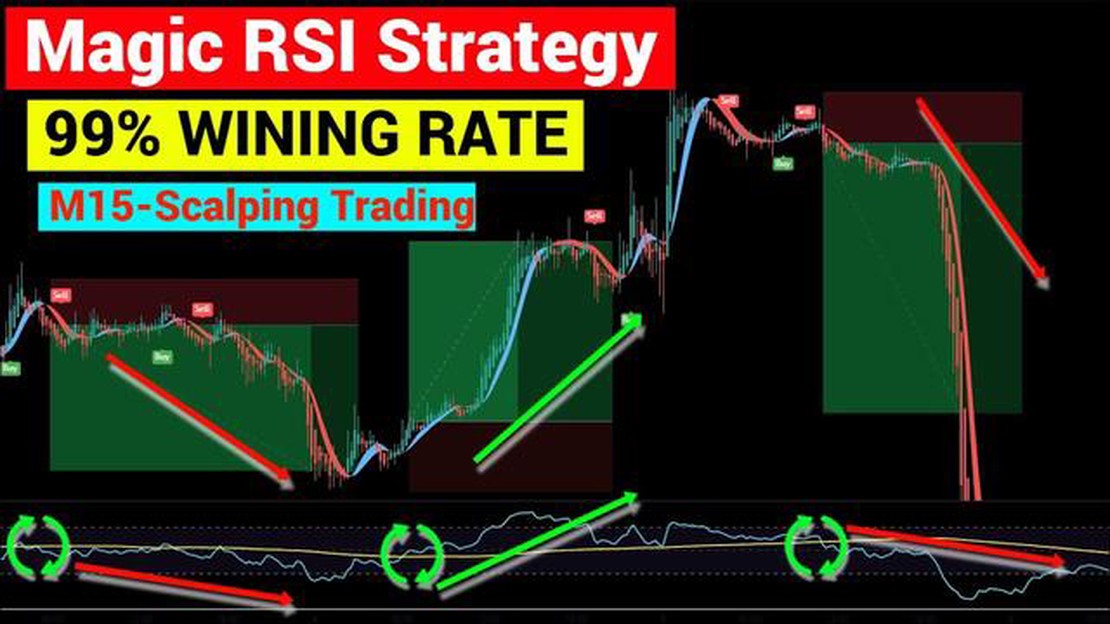
The Relative Strength Index (RSI) is a popular technical indicator used by traders to analyze market momentum and overbought or oversold conditions. It is especially useful for shorter timeframes, such as the 15-minute chart, where traders are looking to make quick trading decisions. However, choosing the right RSI setting for a 15-minute chart can be a challenge, as different settings can produce different signals and outcomes.
One common approach to choosing the RSI setting for a 15-minute chart is to use the default setting of 14 periods. This setting is widely used and has been proven to be effective in many trading strategies. However, some traders prefer to use a shorter RSI period, such as 9 or even 5 periods, to generate faster and potentially more accurate signals.
On the other hand, using a longer RSI period, such as 21 or 30 periods, can provide a more smoothed-out and less volatile RSI reading. This can be helpful in identifying longer-term trends and reducing false signals. However, using a longer period may also result in delayed signals, which can be a disadvantage for traders looking to capitalize on short-term price movements.
Ultimately, the choice of RSI setting for a 15-minute chart will depend on the individual trader’s trading style, risk tolerance, and overall market conditions. It is important to experiment with different settings and analyze historical price data to determine which setting works best for your trading strategy. Remember to always combine the RSI indicator with other technical analysis tools and indicators to confirm your trading signals and minimize false signals. With the right RSI setting and a solid trading plan, you can increase your chances of success in the fast-paced 15-minute chart environment.
When it comes to utilizing the Relative Strength Index (RSI) on a 15-minute chart, choosing the right settings can be critical. The RSI is a popular technical indicator used by traders to identify overbought and oversold conditions in the market.
The RSI is a momentum oscillator that compares the magnitude of recent gains to recent losses in order to determine whether a security is overbought or oversold. The default setting for the RSI is typically 14, but this may not be the ideal setting for a 15-minute chart.
When selecting the ideal RSI setting for a 15-minute chart, it is important to consider the time frame and desired sensitivity. A shorter time frame, such as 15 minutes, may benefit from a lower RSI setting to provide more frequent signals.

A common approach for choosing the ideal RSI setting for a 15-minute chart is to experiment with different values and assess the results. Some traders may find that a shorter RSI setting, such as 9 or 10, provides more accurate and timely signals on a 15-minute chart.
It is also important to consider the characteristics of the specific market being traded. Volatile markets may require a lower RSI setting to capture quick changes in momentum, while less volatile markets may benefit from a higher RSI setting for more reliable signals.
Additionally, it can be useful to combine the RSI with other technical indicators or chart patterns to confirm signals. For example, a trader may look for bullish divergences or oversold conditions on the RSI in conjunction with a trendline break on the price chart.
Ultimately, the ideal RSI setting for a 15-minute chart will depend on individual trading preferences and strategies. Traders should consider experimenting with different settings and analyzing the results to find the optimal setting that best suits their needs.
Read Also: Mastering technical analysis in forex trading: A comprehensive guide
| Factors to Consider | Possible RSI Settings |
|---|---|
| Time Frame | 9, 10, 14 |
| Market Volatility | Lower setting for volatile markets, higher setting for less volatile markets |
| Confirmation | Combine with other indicators or chart patterns |
The Relative Strength Index (RSI) is a popular technical indicator used by traders to identify overbought or oversold conditions in the market. It is a momentum oscillator that compares the magnitude of recent gains to recent losses in an attempt to determine whether an asset is overbought or oversold.
While the RSI is a widely used indicator, it is important to choose the right settings for your specific trading strategy. The default setting for the RSI is usually 14, but this might not be the optimal setting for all timeframes and asset classes.
The RSI settings determine the number of periods used to calculate the indicator’s value. Generally, a shorter period will result in a more sensitive RSI, while a longer period will smooth out the indicator and make it less sensitive to short-term price fluctuations.
Read Also: Discover the Formula for Resistance Support and Its Significance
When choosing the perfect RSI setting for a 15-minute chart, it is important to consider the volatility of the asset being analyzed. A more volatile asset may require a shorter RSI period to capture quick changes in momentum, while a less volatile asset may require a longer RSI period to filter out noise and provide more accurate signals.
Another factor to consider when selecting the RSI setting is the trading timeframe. A shorter timeframe, like a 15-minute chart, requires a shorter RSI period to capture shorter-term price movements. On the other hand, a longer timeframe, like a daily chart, may require a longer RSI period to capture longer-term trends.
It is also important to backtest different RSI settings on historical data to determine which setting works best for your trading strategy. By analyzing past market data, you can evaluate the performance of different RSI settings and choose the one that provides the most accurate signals for your specific trading style.
In conclusion, understanding the importance of RSI settings is crucial in order to effectively use this technical indicator. By selecting the right RSI setting for your 15-minute chart, considering the asset’s volatility and the trading timeframe, as well as conducting thorough backtesting, you can improve your trading performance and make informed trading decisions.

The best RSI setting for a 15-minute chart depends on the specific trading strategy and the market being traded. However, a commonly used setting is 14 periods.
Choosing the perfect RSI setting for a 15-minute chart involves experimentation and adjusting the number of periods until it provides accurate signals for your specific trading strategy. It is recommended to start with the default setting of 14 periods and then make adjustments based on your analysis of price action.
Yes, it is possible to use a different RSI setting for a 15-minute chart. Traders can experiment with different settings, such as 9 or 21 periods, to see which one provides the most accurate signals for their specific trading strategy and the market being traded.
Using a shorter RSI setting, such as 9 periods, for a 15-minute chart can provide more frequent and timely signals. This can be advantageous for traders who prefer a more active trading style and want to enter and exit positions more frequently.
Using a longer RSI setting, such as 21 periods, for a 15-minute chart can result in fewer and potentially delayed signals. This can be a disadvantage for traders who prefer a more active trading style and want to enter and exit positions more frequently.
RSI stands for Relative Strength Index. It is a popular technical indicator used in trading to measure the strength and speed of price movements.

How to Find Your Bank Code in Singapore When it comes to banking in Singapore, knowing your bank code is essential. Your bank code is a unique …
Read Article
Who is the sponsor of Expo 2023 in Qatar? The official sponsor for Expo 2023 in Qatar has finally been revealed, marking a significant milestone in …
Read Article
Understanding the Energy Trading Platform: A Comprehensive Guide Energy trading platforms have become increasingly popular in recent years as a way …
Read Article
Conversion of 1 Million IDR to Euros Have you ever wondered how much 1 million Indonesian Rupiah (IDR) is worth in euros? The exchange rate between …
Read Article
Best Time to Trade in Ghana Ghana, located in West Africa, is known for its vibrant economy and rich trading history. For those looking to engage in …
Read Article
Is 32GB RAM overkill for work? When it comes to determining the ideal amount of RAM for work, many factors come into play. RAM, or Random Access …
Read Article

