

Is Volatility Beneficial for Call Options? - Everything You Need to Know
Volatility and Its Impact on Call Options When it comes to trading options, understanding volatility is crucial. Volatility measures the degree of …
Read Article

When it comes to analyzing stock market trends, one of the most widely used tools is the moving average. This calculation helps traders identify the direction of a stock’s price movement over a specific time frame. For day traders, choosing the right moving average for their charts can be crucial in making informed trading decisions.
But with so many different types of moving averages available, how do you know which one to use?
Experts recommend understanding the characteristics of different moving averages and selecting the one that aligns with your trading strategy and risk tolerance. Simple Moving Average (SMA), Exponential Moving Average (EMA), and Weighted Moving Average (WMA) are the most commonly used types of moving averages.
SMA is the most basic and widely used moving average. It calculates the average price of a stock over a specific number of periods. The EMA gives more weight to recent prices, making it more responsive to current price trends. The WMA assigns greater importance to recent data, similar to the EMA.
Choosing the right moving average depends on various factors, including the time horizon of your trades, the level of volatility in the market, and your risk tolerance. Traders who prefer shorter time frames, such as day traders, often use shorter moving averages like the 20-day or 50-day SMA or EMA. These moving averages provide a more accurate reflection of short-term price trends.
Ultimately, the choice of moving average boils down to personal preference and trading style. It is essential to test different moving averages and analyze their performance to determine which one works best for your needs. With careful consideration and expert advice, you can find the perfect moving average for your day charts and improve your trading success.
Moving averages are a popular technical indicator used by traders and analysts to smooth out price fluctuations and identify trends in financial markets. These indicators help to filter out noise and provide a clearer picture of price action over a specified time period.
A moving average is calculated by taking the average price of a security over a certain number of periods. The most commonly used moving averages are the simple moving average (SMA) and the exponential moving average (EMA).
The SMA calculates the average price over a specified number of periods by summing up the closing prices and dividing it by the number of periods. This method gives equal weight to all data points in the calculation.
The EMA is similar to the SMA, but it places more importance on recent prices and assigns them a higher weighting. This makes the EMA more sensitive to price changes and helps to identify trends more quickly.
Moving averages can be calculated for different time frames, such as days, weeks, or months, depending on the trader’s preference and trading strategy. Shorter time frame moving averages, such as the 20-day or 50-day moving average, are often used to identify short-term trends, while longer time frame moving averages, such as the 200-day moving average, are used to identify longer-term trends.
When analyzing moving averages, traders look for crossovers and divergences to generate buy or sell signals. A crossover occurs when a shorter-term moving average crosses above or below a longer-term moving average. This is often seen as a bullish or bearish signal, depending on the direction of the crossover.

Divergences occur when the price of a security moves in the opposite direction of the moving average. This can be a sign of a potential trend reversal or consolidation period.
Overall, moving averages are versatile tools that can be used in various market conditions to identify trends, generate buy or sell signals, and determine support and resistance levels. Traders should experiment with different moving average types and time frames to find the perfect fit for their trading strategy.
There are several types of moving averages that traders use to analyze price data and identify trends. Each type of moving average has its own advantages and disadvantages, and traders must choose the one that suits their trading style and goals.
Read Also: Understanding Charts: Do They Display Bid or Ask Price?3. It is easy to calculate and interpret, making it popular among beginner traders. 4. However, the SMA can be slow to respond to recent price changes, which can lead to lagging signals.
5. Exponential Moving Average (EMA):
Read Also: Comparing Weighted Moving Average and Exponential Moving Average Methods6. The EMA places more weight on recent prices and is considered to be a more responsive moving average. 7. It is calculated using a different formula that gives more weight to recent data points. 8. Traders often use the EMA to capture short-term trends and generate faster signals. 9. Weighted Moving Average (WMA): 10. The WMA assigns different weights to each data point in the moving average calculation. 11. Recent data points are given more weight, while older data points have less significance. 12. This type of moving average can provide a balance between the SMA and EMA, offering a compromise between responsiveness and smoothness.
 13. Hull Moving Average (HMA):
14. The HMA is a relatively new type of moving average that aims to reduce lag and provide accurate signals.
15. It uses weighted moving averages and a square root of the period to create a smooth line that closely tracks the price.
16. This type of moving average is popular among day traders and swing traders who rely on quick and accurate signals.
17. Adaptive Moving Average (AMA):
18. The AMA adjusts its speed and sensitivity to market conditions, making it suitable for volatile markets.
19. It uses a combination of different moving averages to create a more flexible and adaptable indicator.
20. The AMA can help traders identify trend reversals and stay on the right side of the market.
13. Hull Moving Average (HMA):
14. The HMA is a relatively new type of moving average that aims to reduce lag and provide accurate signals.
15. It uses weighted moving averages and a square root of the period to create a smooth line that closely tracks the price.
16. This type of moving average is popular among day traders and swing traders who rely on quick and accurate signals.
17. Adaptive Moving Average (AMA):
18. The AMA adjusts its speed and sensitivity to market conditions, making it suitable for volatile markets.
19. It uses a combination of different moving averages to create a more flexible and adaptable indicator.
20. The AMA can help traders identify trend reversals and stay on the right side of the market.
By understanding the different types of moving averages and their characteristics, traders can make informed decisions when selecting the perfect moving average for their day charts.
A moving average is a commonly used technical indicator in day trading that helps smooth out price data over a specified period of time. Traders use moving averages to identify trends, determine support and resistance levels, and generate buy or sell signals.
The two most commonly used types of moving averages in day trading are the simple moving average (SMA) and the exponential moving average (EMA). The SMA gives equal weightage to all data points, while the EMA assigns more weightage to recent data.
Choosing the perfect moving average for day charts depends on various factors, such as the trading strategy, time horizon, and volatility of the market. Generally, shorter moving averages like the 10-day or 20-day SMA or EMA are used for short-term trading, while longer moving averages like the 50-day or 200-day SMA or EMA are used for long-term trading.
Yes, many traders use multiple moving averages in their trading strategy. By using different time periods for the moving averages, such as a combination of 10-day and 50-day SMA or EMA, traders can identify different signals and confirm trends. This can help improve the accuracy of trading decisions.

Volatility and Its Impact on Call Options When it comes to trading options, understanding volatility is crucial. Volatility measures the degree of …
Read Article
Is forex gain subject to income tax? Forex trading, also known as foreign exchange trading, has become increasingly popular in recent years thanks to …
Read Article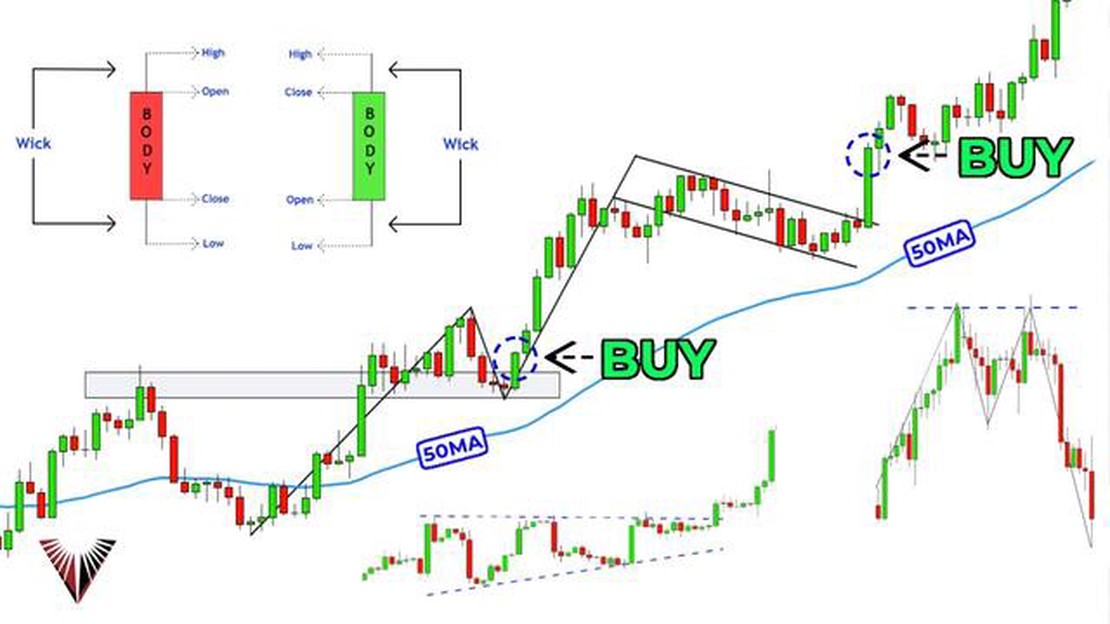
Understanding FX Strategies: From Basics to Advanced Techniques Forex trading can be a highly profitable venture, but it requires skill, knowledge, …
Read Article
Drawbacks of Binary Representation The binary system is a numerical system that uses only two digits, 0 and 1, to represent all numbers and data. …
Read Article
Should You Hedge Your Bets? Exploring the Benefits and Risks Hedging a bet is a commonly used strategy in the world of finance and investing. Whether …
Read Article
Best platform for stock trading in the Philippines Investing in the stock market is a great way to grow your wealth and secure your financial future. …
Read Article


