


Understanding the Moving Average in Management: Key Concepts and Benefits
Understanding the Moving Average in Management In the fast-paced world of business and management, companies are constantly seeking ways to stay ahead …
Read Article
Swing trading is a popular trading strategy among traders who want to take advantage of short-term price fluctuations. It involves taking positions in a stock or other financial instrument with the intention of holding it for a few days to several weeks. One of the most commonly used tools in swing trading is the Moving Average Convergence Divergence (MACD) indicator. The MACD is a trend-following momentum indicator that helps traders identify potential buy and sell signals.
The MACD consists of two lines – the MACD line and the signal line – as well as a histogram. When the MACD line crosses above the signal line, it generates a bullish signal, indicating that it may be a good time to buy the financial instrument. Conversely, when the MACD line crosses below the signal line, it generates a bearish signal, indicating that it may be a good time to sell or short the financial instrument.
While the MACD can be a useful tool for swing traders, it is important to note that it should not be used in isolation. It is always advisable to use the MACD in conjunction with other technical indicators and strategies to confirm signals and increase the probability of successful trades. Additionally, it is important for swing traders to have a clear understanding of the current market conditions and the overall trend before making trading decisions based on the MACD.
In conclusion, the MACD can be a valuable tool for swing traders looking to capitalize on short-term price fluctuations. By using the MACD in conjunction with other technical indicators and strategies, swing traders can increase their chances of making profitable trades. However, it is crucial for swing traders to have a solid understanding of market conditions and trends to effectively use the MACD and make informed trading decisions.
“The MACD can be a helpful indicator for swing traders, but it should never be the sole basis for making trading decisions.”
The MACD line is calculated by subtracting the 26-period exponential moving average (EMA) from the 12-period EMA. The signal line is a 9-period EMA of the MACD line. The histogram represents the difference between the MACD line and the signal line, providing visual cues about the strength of the trend.
Read Also: Understanding the X12 Seasonal Adjustment and Its Importance for Accurate Data Analysis
For swing traders, the MACD can be a valuable tool for identifying potential swing reversal points and determining overall trend direction. When the MACD line crosses above the signal line, it is considered a bullish signal, indicating that it may be a good time to enter a long position. Conversely, when the MACD line crosses below the signal line, it is a bearish signal, suggesting a potential opportunity to enter a short position.
Swing traders also pay attention to the divergence between the MACD and the price of the asset being traded. If the price is making higher highs while the MACD is making lower highs, it is a bearish divergence and could indicate a potential trend reversal. Conversely, if the price is making lower lows while the MACD is making higher lows, it is a bullish divergence and could suggest an upcoming trend reversal.
While the MACD can be a useful tool for swing traders, it is important to note that it is just one piece of the puzzle. It should be used in conjunction with other technical indicators and analysis methods to make well-informed trading decisions. Additionally, swing traders should also consider factors such as volume, support and resistance levels, and market trends when using the MACD to develop their swing trading strategies.
In conclusion, the MACD is a popular and powerful tool for swing traders. By understanding how to interpret the MACD line, signal line, and histogram, swing traders can gain valuable insights into market momentum and direction. However, it is important to use the MACD in conjunction with other technical indicators and analysis methods to maximize the effectiveness of swing trading strategies.
MACD, which stands for Moving Average Convergence Divergence, is a popular technical analysis indicator used by traders to identify potential buy and sell signals in a stock or other financial instrument. It is comprised of two lines, the MACD line and the signal line, as well as a histogram.
The MACD line is calculated by subtracting the longer-term exponential moving average (EMA) from the shorter-term EMA. The signal line, on the other hand, is a moving average of the MACD line itself. The histogram represents the difference between the MACD line and the signal line.
Traders use the MACD indicator to identify when a stock is overbought or oversold, as well as to determine the strength of a trend. When the MACD line crosses above the signal line, it is considered a bullish signal indicating that it might be a good time to buy the stock. Conversely, when the MACD line crosses below the signal line, it is considered a bearish signal indicating that it might be a good time to sell the stock.
MACD can be used for swing trading by applying it to different timeframes. Swing traders typically look for short-term trading opportunities that arise from market fluctuations. By using the MACD indicator on shorter timeframes, such as the 1-hour or 4-hour chart, swing traders can identify potential entry and exit points for their trades.
Read Also: Can you trade stock options on eToro? - Explained
It is important to note that while MACD can be a useful tool for swing trading, it should not be used as the sole indicator for making trading decisions. It is always recommended to use MACD in conjunction with other technical indicators, as well as fundamental analysis, to increase the accuracy of trading signals.

Swing trading is a short-term trading strategy that aims to capture short-term price movements in a financial instrument. Traders who employ swing trading typically hold positions for a few days to a few weeks, taking advantage of price fluctuations within a larger trend.
MACD stands for Moving Average Convergence Divergence. It is a popular technical indicator used by traders to identify potential trend reversals, momentum shifts, and generate buy or sell signals. The MACD is calculated by subtracting the 26-day exponential moving average (EMA) from the 12-day EMA, and then plotting a 9-day EMA as the signal line.
MACD can be used for swing trading by helping traders identify potential buy or sell signals. When the MACD line crosses above the signal line, it generates a bullish signal indicating a potential buy opportunity. Conversely, when the MACD line crosses below the signal line, it generates a bearish signal indicating a potential sell opportunity. Traders can use these signals as entry and exit points for swing trades.
Yes, there are some limitations to using MACD for swing trading. Like any technical indicator, MACD is not infallible and can provide false signals. It is important for traders to use MACD in conjunction with other indicators or analysis tools to confirm signals and avoid false signals. Additionally, swing traders should consider the overall market conditions and other factors that may impact price movements before relying solely on MACD signals.

Understanding the Moving Average in Management In the fast-paced world of business and management, companies are constantly seeking ways to stay ahead …
Read Article
Forex Trader Job Description: What You Need to Know Forex trading, also known as foreign exchange trading, is a fast-paced and dynamic market that …
Read Article
Is forex considered a financial asset? Forex, short for foreign exchange, is a global decentralized market for trading currencies. As one of the …
Read Article
Types of Hammers in Forex: A Comprehensive Guide Forex trading involves the buying and selling of currencies in order to make a profit. This financial …
Read Article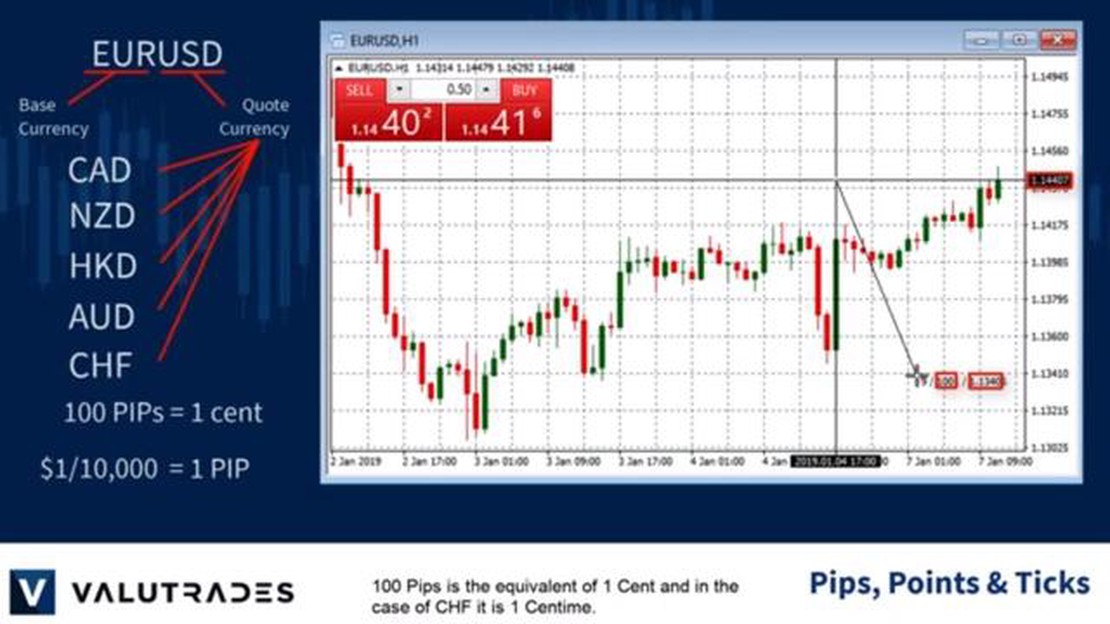
How many pips is 1 point? Forex trading involves the buying and selling of currencies, and it is important to understand the concept of pips and …
Read Article
Reasons for the Failure of the Majority of Options Traders Options trading can be an enticing and potentially profitable endeavor for those looking to …
Read Article


