

How to Read EMA in Forex: A Comprehensive Guide
How to read EMA Forex In the world of forex trading, one of the most commonly used technical indicators is the Exponential Moving Average (EMA). The …
Read Article
If you are a trader or investor in the stock market, you may have heard about the moving average and its importance in technical analysis. The moving average is a widely used indicator that helps traders identify the trend and make informed decisions. In this article, we will be discussing how to calculate the moving average for the NIFTY index, which is the benchmark index for the National Stock Exchange of India.
To calculate the NIFTY moving average, you will need historical price data for the index. The moving average is calculated by taking the average of a specific number of periods, such as 10 days, 50 days, or 200 days. This helps smooth out the price data and reveal the underlying trend.
There are different types of moving averages, but the most commonly used ones are the simple moving average (SMA) and the exponential moving average (EMA). The SMA gives equal weightage to each period, while the EMA gives more weightage to recent periods. Both can be used depending on your trading strategy and time horizon.
Formula for calculating the Simple Moving Average (SMA):
SMA = (Sum of closing prices for the specified number of periods) / (Number of periods)
Formula for calculating the Exponential Moving Average (EMA):
EMA = (Current closing price * Smoothing factor) + (Previous EMA * (1 - Smoothing factor))
Calculating the NIFTY moving average can help you identify potential entry and exit points, as well as determine the overall trend of the market. It is important to note that moving averages are lagging indicators and should be used in conjunction with other technical analysis tools for better accuracy.
In conclusion, understanding how to calculate the NIFTY moving average is essential for traders and investors in the Indian stock market. By using this indicator, you can make more informed decisions and increase your chances of success in the market.

In technical analysis, moving average is a commonly used indicator to analyze the trend of a financial instrument, such as stocks or indices. It provides valuable insights into the overall direction and strength of the market.
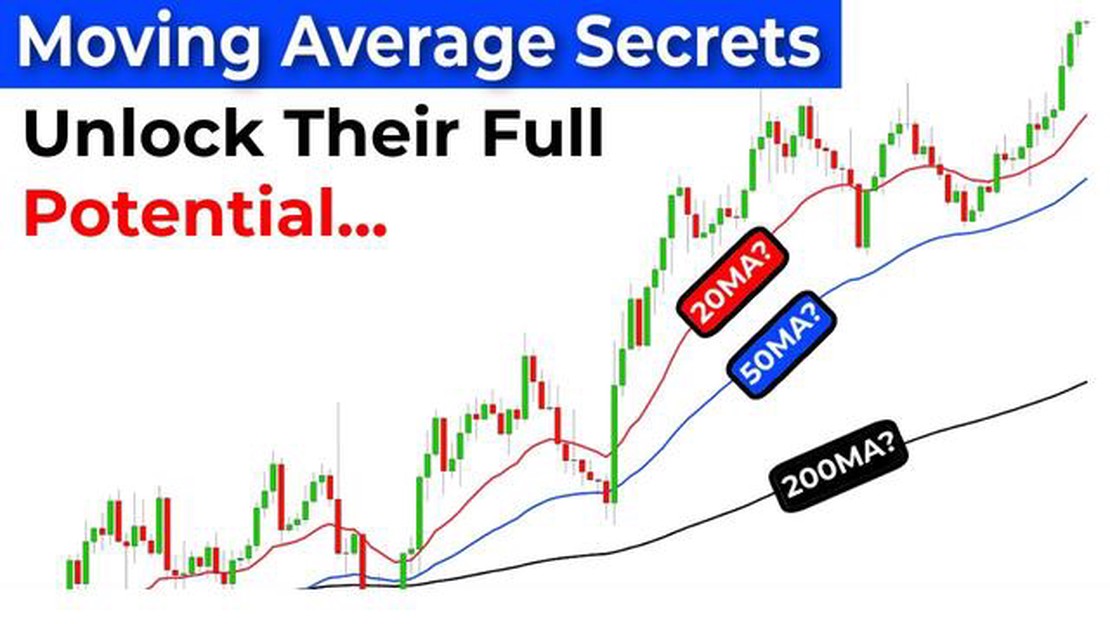
A moving average is calculated by taking the average price over a specified period of time, known as the “lookback” or “period”. The most commonly used periods are 50, 100, and 200 days.
The moving average is represented by a smooth line on a price chart, which helps traders identify potential support and resistance levels, as well as trend reversals. It smooths out the fluctuations in price and provides a clearer picture of the underlying trend.
There are two types of moving averages: simple moving average (SMA) and exponential moving average (EMA). SMA calculates the average price over the specified period equally, while EMA gives more weightage to recent prices.
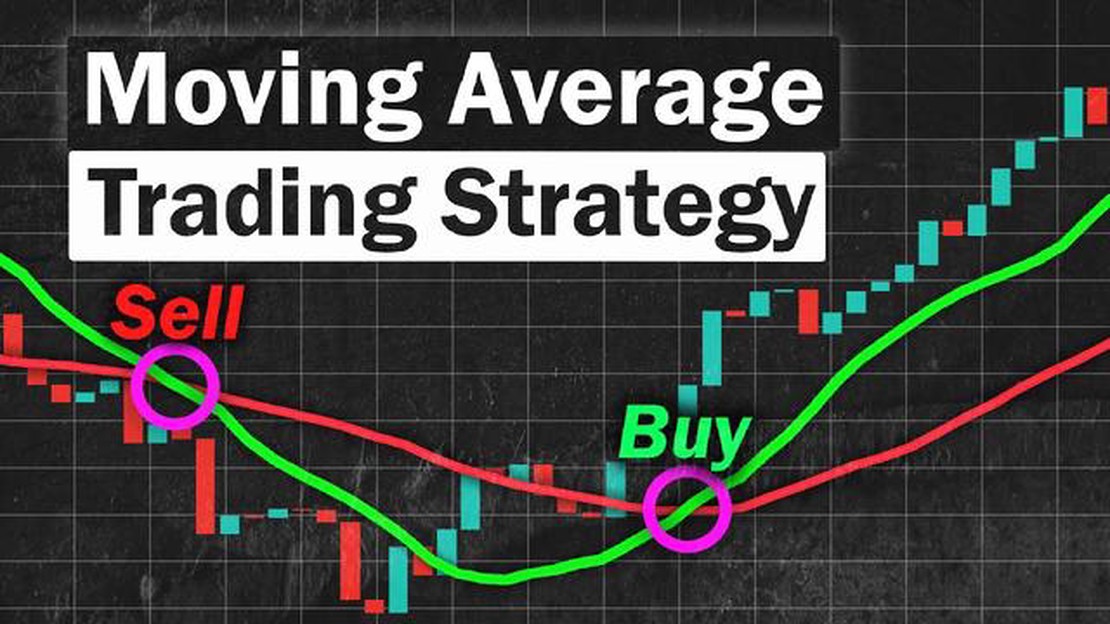
Traders use moving averages in various ways. One common strategy is to identify the crossover of two moving averages, such as the 50-day and 200-day moving averages. When the shorter-term moving average crosses above the longer-term moving average, it is considered a bullish signal, indicating a potential upward trend. Conversely, when the shorter-term moving average crosses below the longer-term moving average, it is a bearish signal.
Read Also: Choosing the Best Trading Room for Forex: Expert Recommendations and Analysis
Another use of moving averages is to determine dynamic support and resistance levels. If the price is consistently above the moving average, it can act as a support level. Conversely, if the price is consistently below the moving average, it can act as a resistance level.
Moving averages can also be used to identify trend reversals. When the price crosses above or below the moving average, it can signal a change in trend.
In conclusion, moving averages are powerful tools for technical analysis. They help traders identify trends, support and resistance levels, and potential trend reversals. By understanding how to calculate and interpret moving averages, traders can make more informed decisions in the market.
1. Gather the data: Collect the closing prices of NIFTY stocks over a specific period of time. The more data points you have, the more accurate your moving average will be.
Read Also: Why is the Swiss franc so strong: Understanding the factors behind its economic power
2. Determine the time period: Decide on the time period for which you want to calculate the moving average. It can be days, weeks, months, or any other interval.
3. Calculate the simple moving average: Add up the closing prices for the specified time period and divide the sum by the number of data points. This will give you the simple moving average for that particular time period.
4. Repeat the process: Move the time window forward by one data point and calculate the simple moving average again. Repeat this step until you have calculated the moving average for all the data points.
5. Plot the moving average: Once you have calculated the moving averages, plot them on a graph along with the corresponding time periods. This will help you visualize the trend and identify potential buying or selling opportunities.
6. Interpret the moving average: Analyze the moving average to understand the overall trend of the NIFTY stocks. If the moving average is trending upwards, it indicates a bullish market. Conversely, a downward trend suggests a bearish market.

7. Use other indicators: Consider using other technical indicators, such as relative strength index (RSI) or moving average convergence divergence (MACD), to confirm the signals provided by the moving average.
8. Adjust the time period: Experiment with different time periods to find the one that best suits your trading strategy. Shorter time periods provide more frequent signals, while longer time periods offer more reliable signals.
9. Stay updated: Regularly update your moving averages as new data becomes available. This will ensure that your analysis remains accurate and up to date.
Remember, calculating the moving average is just one aspect of technical analysis. It should be used in conjunction with other tools and indicators to make informed trading decisions.
NIFTY moving average is a technical analysis tool used to analyze the historical price trend of the NIFTY index in the stock market.
Calculating NIFTY moving average is important as it helps in identifying the overall direction of the market trend, which can assist traders and investors in making informed decisions about buying or selling stocks.
The simple moving average (SMA) for NIFTY is calculated by adding up the closing prices of NIFTY index for a specific number of periods (days, weeks, months) and then dividing it by the number of periods.
The formula for calculating the exponential moving average (EMA) for NIFTY is EMA = (Closing Price - EMA(previous day)) * (2 / (number of periods + 1)) + EMA(previous day).

How to read EMA Forex In the world of forex trading, one of the most commonly used technical indicators is the Exponential Moving Average (EMA). The …
Read Article
ICICI Bank Forex Services: Everything You Need to Know ICICI Bank, one of the leading banks in India, offers a wide range of services to its …
Read Article
Is It Possible to Make 1% a Day Day Trading? Day trading is an appealing option for those who want to make money quickly in the financial markets. …
Read Article
The Phone Number of Dubai Embassy If you are planning a trip to Dubai and you need to contact the embassy for any reason, it is important to have …
Read Article
Understanding Options Trading: A Beginner’s Guide Options trading can be a complex and intimidating concept for beginners, but with a little guidance, …
Read Article
Understanding the Concept of Trading Strategy Trading strategy is a crucial aspect of the financial markets, guiding traders in making informed …
Read Article


