


Payment options at Hong Kong airport: Everything you need to know
Payment methods at Hong Kong airport When traveling through Hong Kong International Airport, it’s important to be aware of the various payment options …
Read Article
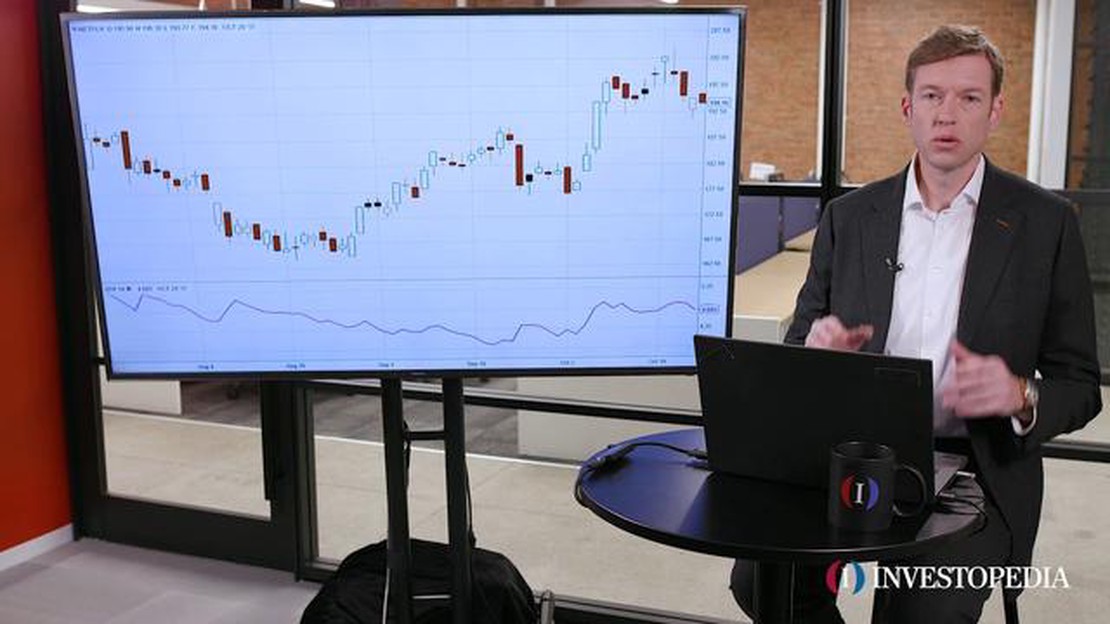
Volatility is a crucial element in understanding the financial markets. It measures the magnitude of price movements of a financial instrument over a specific time period. Traders and investors use volatility as an indicator to assess the risk associated with an investment, make informed decisions, and develop trading strategies.
Calculating and understanding average volatility can help traders and investors assess the average expected price fluctuations in a financial market. By knowing the average volatility, traders can better manage their risk and make more informed investment decisions.
There are various methods to calculate average volatility, with each method having its own advantages and limitations. One commonly used method is the standard deviation. The standard deviation calculates the dispersion of a set of data points from its mean, providing an indication of how much the data points vary from the average. By calculating the standard deviation of an asset’s price movements over a specific time period, traders can estimate the average volatility.
Another approach to calculating average volatility is using the average true range (ATR). The ATR measures the average range between the high and low prices over a specific time period, providing an indication of the average volatility. The ATR takes into account any gaps or limit moves in the price, making it a suitable measure for capturing the true price range volatility.
Knowing how to calculate average volatility is an essential skill for traders and investors. By understanding the average expected price movements, traders can adapt their strategies, set realistic target levels and stop-loss orders, and manage risk effectively. Whether using the standard deviation or the average true range, calculating average volatility empowers traders to make informed decisions and thrive in the dynamic world of financial markets.
Volatility is a key concept in financial markets, representing the degree of variation in the price of a financial instrument over time. It measures the rate at which the price of an asset rises or falls. Understanding volatility is crucial for investors and traders, as it helps them assess the level of risk associated with an investment or trading strategy.
There are different types of volatility measures that can be used to quantify the degree of price variation. One common measure is historical volatility, which calculates the standard deviation of past price returns. Another measure is implied volatility, which is derived from the prices of options contracts and reflects market participants’ expectations of future price movement.
Volatility is influenced by various factors, including market conditions, economic indicators, and geopolitical events. High volatility is often observed during periods of market uncertainty or significant news events, such as economic crises or political instability. Conversely, low volatility is typically seen in stable market environments.
Volatility can have both positive and negative implications for investors and traders. On one hand, high volatility can provide opportunities for profit, as larger price swings present more trading opportunities. On the other hand, high volatility can also increase the level of risk, as prices can move quickly and unpredictably. Low volatility, while generally considered less risky, may limit trading opportunities and potential returns.

Investors and traders can use volatility measures to assess the level of risk associated with different assets or investment strategies. For example, a low-volatility stock may be suitable for conservative investors seeking stable returns, while a high-volatility stock may be more suitable for aggressive traders looking for potential short-term gains.
Overall, understanding volatility is essential for navigating financial markets effectively. By assessing and managing volatility, investors and traders can make informed decisions and optimize their risk-reward profiles.
Read Also: What is the minimum deposit for Oanda? | Complete guide
Volatility refers to the degree of variation or fluctuation in the price of a financial instrument over a specific period of time. It is a statistical measure that quantifies the magnitude of price swings.
Volatility is an essential concept in the financial markets, as it is directly linked to risk. Generally, higher volatility suggests greater uncertainty and potential for larger price movements, implying higher risk. On the other hand, lower volatility indicates more stability and fewer price fluctuations.
There are different types of volatility, including historical volatility and implied volatility. Historical volatility looks at past price movements to analyze how much the price has varied in the past. Implied volatility, on the other hand, is derived from options pricing and reflects market expectations of future price fluctuations.
Traders and investors often use volatility to manage their risk. Higher volatility may present opportunities for profit but also carries a higher likelihood of losses. By understanding and measuring volatility, market participants can make more informed decisions about when to enter or exit positions.
It is important to note that volatility is not synonymous with the direction of price movements. A financial instrument can exhibit high volatility while moving in an upward trend, downward trend, or even trading sideways. Volatility simply measures the magnitude of price swings, regardless of the direction.
In summary, volatility is a crucial concept in the financial markets that quantifies the degree of price fluctuations. It is a key factor that traders and investors consider when analyzing risk and making investment decisions.
Read Also: What is BB in stock? A comprehensive guide to understanding BB in stock trading
Volatility is an important concept in financial markets, as it helps investors and traders assess the potential risks and rewards of an investment. It is a measure of how much the price of a financial instrument, such as a stock or a currency pair, changes over a certain period of time.
Here are some reasons why volatility is important:

| Determining Risk: Volatility can be used as a measure of risk. Investments with high volatility are generally considered riskier, as they have a greater potential for large price swings. On the other hand, investments with low volatility are seen as less risky, as they are expected to have smaller price fluctuations. |
| Setting Expectations: Volatility provides investors and traders with an idea of what to expect in terms of price movements. If a stock has a history of high volatility, investors can anticipate larger price swings and adjust their trading strategies accordingly. Conversely, if a stock has low volatility, investors can expect smaller price movements and adjust their strategies accordingly. |
| Assessing Investment Opportunities: Volatility can help investors identify potential investment opportunities. Stocks or other financial instruments experiencing high volatility may present opportunities for short-term traders looking to profit from large price swings. Conversely, low-volatility investments may be more suitable for long-term investors seeking stability and steady returns. |
| Portfolio Diversification: Volatility is an important factor to consider when diversifying a portfolio. By including assets with different levels of volatility, investors can mitigate the overall risk of their portfolio. Combining high-volatility and low-volatility investments can help achieve a balance and potentially enhance the risk-return profile of the portfolio. |
In conclusion, volatility plays a crucial role in financial markets by providing valuable information about risk, setting expectations, identifying investment opportunities, and facilitating portfolio diversification. Understanding and analyzing volatility can help investors make informed decisions and manage their investment portfolios effectively.
Average volatility is a statistical measure that calculates the average amount by which the price of a financial instrument fluctuates over a period of time.
You can calculate average volatility by taking the average of the absolute differences between each day’s closing price and the previous day’s closing price over a certain period of time.
Average volatility is important because it gives traders and investors a sense of how much a financial instrument’s price may fluctuate in the future. It helps them assess the risk and potential rewards of investing in a particular instrument.
The formula for calculating average volatility is: (Sum of the absolute differences between each day’s closing price and the previous day’s closing price) / (Number of days).
Some common time periods used for calculating average volatility are 10 days, 20 days, 50 days, and 100 days. Traders and investors may choose different time periods based on their trading strategies and investment goals.
Volatility is a measure of how much the price of a financial instrument, such as a stock or a currency pair, fluctuates over a given period of time. It is often used as an indicator of market risk and can help investors make informed decisions.

Payment methods at Hong Kong airport When traveling through Hong Kong International Airport, it’s important to be aware of the various payment options …
Read Article
Can AI replace human traders? Artificial intelligence (AI) is revolutionizing various industries, and the trading industry is no exception. With its …
Read Article
Chart Pattern Recognition Indicator for MT4: A Comprehensive Guide Chart pattern recognition is an essential tool for traders to identify potential …
Read Article
Is GTS available in Pokemon Black? Pokemon Black is a popular video game in the Pokemon franchise that was released for the Nintendo DS console. It is …
Read Article
How to hedge with the VIX? In today’s volatile financial markets, investors are constantly searching for ways to hedge their portfolios against …
Read Article
How much money can you withdraw from ASB per day? Do you ever find yourself needing to withdraw a large amount of cash from your ASB account? If so, …
Read Article


