
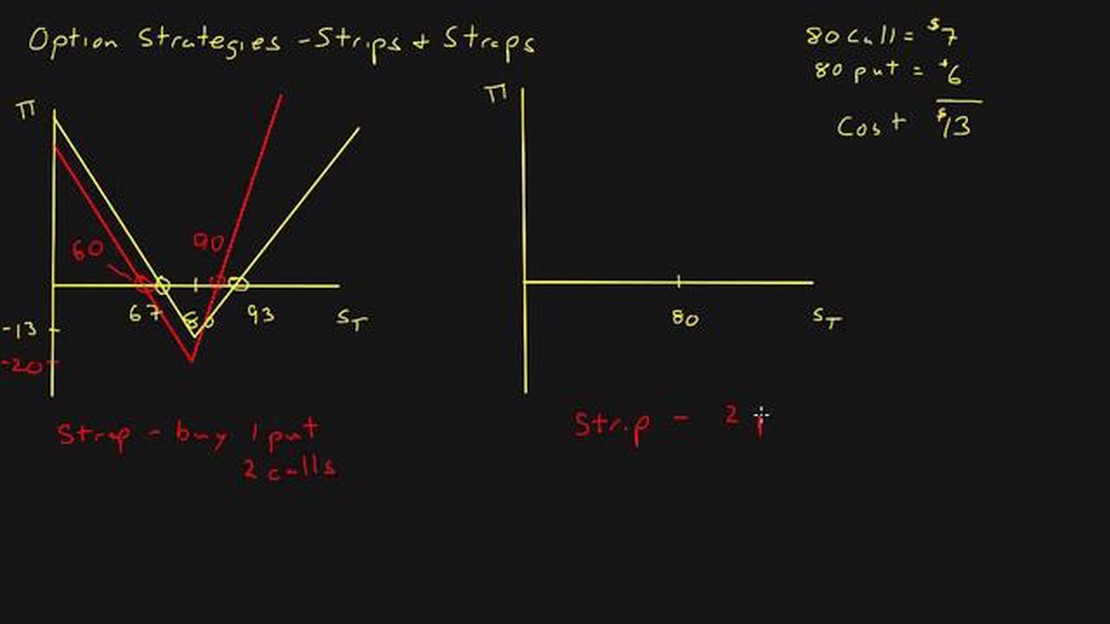

An example of a strip strategy: How to Maximize Profitability with a Strategic Pricing Approach
An Example of a Strip Strategy Introduction In today’s competitive business landscape, companies are constantly seeking ways to maximize …
Read Article
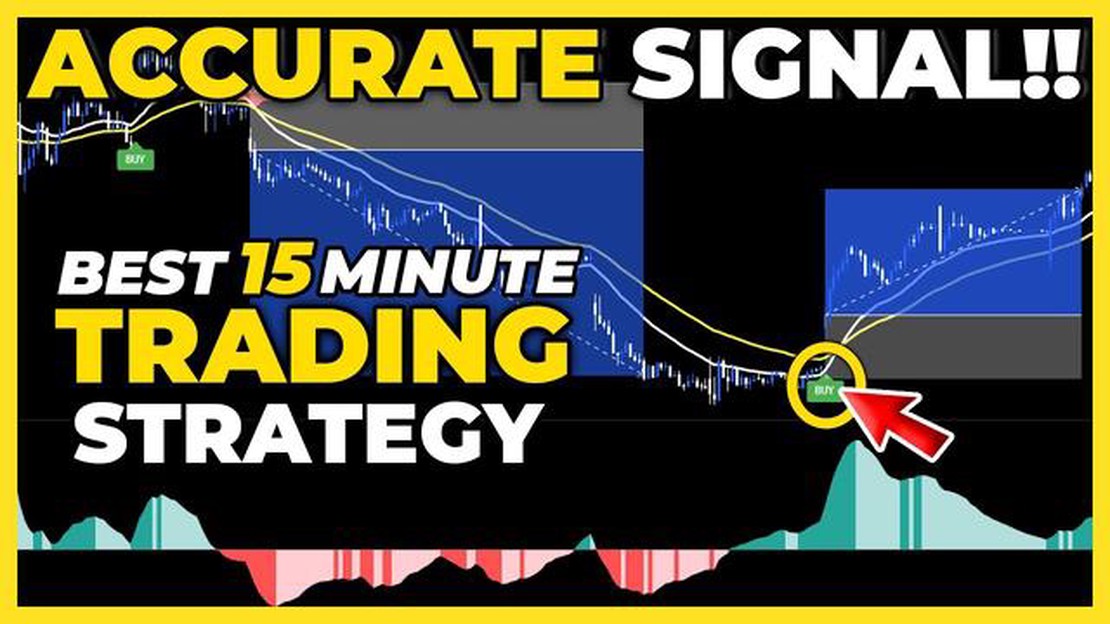
Welcome to our comprehensive guide on the best indicators for a 15-minute chart. Trading on a 15-minute chart can provide traders with insights into short-term price movements and help identify potential trading opportunities. However, to make informed trading decisions, it is essential to use the right indicators. In this guide, we will explore some of the most effective indicators specifically designed for the 15-minute chart and discuss how they can be used to enhance trading strategies.
One of the first indicators we will discuss is the Moving Average (MA). The MA is a widely used indicator that helps traders identify trends and potential price reversals. By calculating the average price over a specific period, such as 10 or 20 periods, the MA smooths out price fluctuations and provides a clearer picture of the overall trend. Traders can use the MA to determine whether the price is trending upwards or downwards and use it as a reference for potential entry and exit points.
Another useful indicator for the 15-minute chart is the Relative Strength Index (RSI). The RSI is a momentum oscillator that measures the speed and change of price movements. It is particularly effective in identifying overbought and oversold conditions in the market. Traders can use the RSI to determine whether an asset is overbought and likely to experience a price correction or oversold and likely to rebound. By combining the RSI with other technical analysis tools, traders can increase their chances of making profitable trades on the 15-minute chart.
Lastly, we will explore the Bollinger Bands indicator. The Bollinger Bands consist of a simple moving average and two standard deviation lines that are plotted above and below the moving average. The width of the Bollinger Bands represents price volatility, with narrower bands indicating lower volatility and wider bands indicating higher volatility. Traders can use the Bollinger Bands to identify potential breakouts or price reversals when the price moves outside the bands. By combining the Bollinger Bands with other indicators, traders can generate more accurate signals on the 15-minute chart.
In conclusion, trading on a 15-minute chart can be a profitable strategy if the right indicators are used. The Moving Average, Relative Strength Index, and Bollinger Bands are just a few examples of indicators that can help traders make informed decisions and increase their chances of success. However, it is important to note that indicators should not be used in isolation and should be combined with other forms of analysis for optimal results. We hope this guide has provided you with valuable insights and will assist you in developing your own trading strategy for the 15-minute chart.
Indicators play a crucial role in analyzing and interpreting price movements on 15 minute charts. These indicators are powerful tools that traders use to identify trends, confirm price patterns, and make informed trading decisions.
One of the key advantages of using indicators on 15 minute charts is that they provide valuable insights into short-term price movements. As a trader, it is essential to have a clear understanding of market trends and the direction in which prices are moving. Indicators can help you identify trends and signals that may not be obvious from a simple price chart.
Another benefit of using indicators for 15 minute charts is their ability to confirm price patterns. Whether it’s a bullish or bearish pattern, indicators can provide confirmation of the pattern and help you enter or exit trades at the right time. By using indicators to confirm these patterns, you can reduce the risk of false breakouts or false reversals.

Furthermore, indicators on 15 minute charts can help you make informed trading decisions. They can provide valuable information about the strength of a trend, overbought or oversold conditions, and potential price targets. By incorporating indicators into your trading strategy, you can increase your chances of making profitable trades and minimizing losses.
It’s important to note that choosing the right indicators for 15 minute charts is crucial. Not all indicators are suitable for short-term trading. Some indicators may work better on longer timeframes, while others may provide false signals on shorter timeframes. Therefore, it is essential to select indicators that align with your trading goals and strategies.
In conclusion, using indicators for 15 minute charts is vital for successful trading. They provide valuable insights into price movements, confirm price patterns, and help you make informed trading decisions. By choosing the right indicators and incorporating them into your trading strategy, you can enhance your trading performance and increase the likelihood of achieving your financial goals.
Read Also: Why Avoid Trading on Fridays? Top Reasons and Tips
When selecting the best indicators for a 15 minute chart, there are several factors that traders should take into consideration. These factors can greatly affect the accuracy and effectiveness of the indicators used.
1. Timeframe: The 15 minute chart is a relatively short timeframe, so it is important to choose indicators that work well in this time frame. Some indicators may work better on longer timeframes, while others may be more suitable for shorter timeframes.
2. Market conditions: Different indicators perform differently depending on the market conditions. For example, trend-following indicators may work well in trending markets, while oscillators may work better in ranging markets. Traders should consider the current market conditions and select indicators accordingly.
3. Trading strategy: Traders should choose indicators that align with their trading strategy. For example, if the strategy is based on trend following, indicators such as moving averages or MACD may be more suitable. On the other hand, if the strategy focuses on finding overbought or oversold conditions, indicators like the RSI or Stochastic Oscillator may be more useful.
Read Also: Is Forex Trading Legal in the Netherlands? Understanding the Laws and Regulations
4. Accuracy and reliability: It is important to select indicators that provide accurate and reliable signals. Traders should test the indicators and analyze their performance before using them in live trading. Backtesting and demo trading can help identify indicators that may be more accurate and reliable in the 15 minute chart.
5. Simplicity: Complex indicators may be difficult to understand and interpret, especially for novice traders. It is generally recommended to use indicators that are easy to understand and provide clear signals. Simple indicators like moving averages or trendlines can be effective in the 15 minute chart.
6. Personal preferences: Ultimately, traders should consider their own preferences and trading style when selecting indicators. Some traders may prefer indicators that provide more signals, while others may prefer indicators that provide fewer but higher quality signals. It is important to find a balance that suits individual preferences and trading goals.

By carefully considering these factors, traders can choose the best indicators for a 15 minute chart that align with their trading strategy and increase the probability of making successful trades.
There are several indicators that can be effective on a 15 minute chart, including the moving averages, RSI, MACD, and Bollinger Bands. These indicators can provide valuable insights into market trends, momentum, and potential price reversals.
Moving averages are a commonly used indicator on a 15 minute chart. They help to smooth out price movements and identify the overall trend. The most commonly used moving averages on a 15 minute chart are the 9-period, 21-period, and 50-period moving averages. Traders often look for crossovers between these moving averages as a signal to enter or exit a trade.
The Relative Strength Index (RSI) is a popular indicator that measures the speed and change of price movements. On a 15 minute chart, the RSI can be used to identify overbought and oversold conditions. A reading above 70 indicates an overbought market, while a reading below 30 indicates an oversold market. Traders can use these levels to identify potential reversals or continuation of trends.
Yes, the Moving Average Convergence Divergence (MACD) can be effective on a 15 minute chart. The MACD consists of two lines - the MACD line and the signal line. When the MACD line crosses above the signal line, it is considered a bullish signal, indicating that it may be a good time to enter a long trade. Conversely, when the MACD line crosses below the signal line, it is considered bearish, suggesting it may be a good time to enter a short trade. Traders can use these crossovers as well as divergence between the MACD and the price to make trading decisions.
Bollinger Bands are a technical indicator that consists of a simple moving average and two standard deviation bands. They help to identify market volatility and potential price reversals. On a 15 minute chart, when the price touches or crosses the upper band, it may indicate an overbought condition, while touching or crossing the lower band may indicate an oversold condition. Traders can use these signals along with other indicators to make informed trading decisions.

An Example of a Strip Strategy Introduction In today’s competitive business landscape, companies are constantly seeking ways to maximize …
Read Article
The tradability of NDX Are you interested in trading NDX but don’t know where to start? Look no further! In this comprehensive guide, we will take you …
Read Article
Top 10 Stocks to Buy in 2023 Investing in the stock market can be a daunting task, especially with so many companies to choose from. However, by …
Read Article
Is RoboForex a regulated broker? When it comes to choosing a brokerage firm, one of the most important factors to consider is whether it is regulated …
Read Article
Effective Ways to Promote Your Forex Business In today’s highly competitive online forex market, effectively marketing and promoting your forex …
Read Article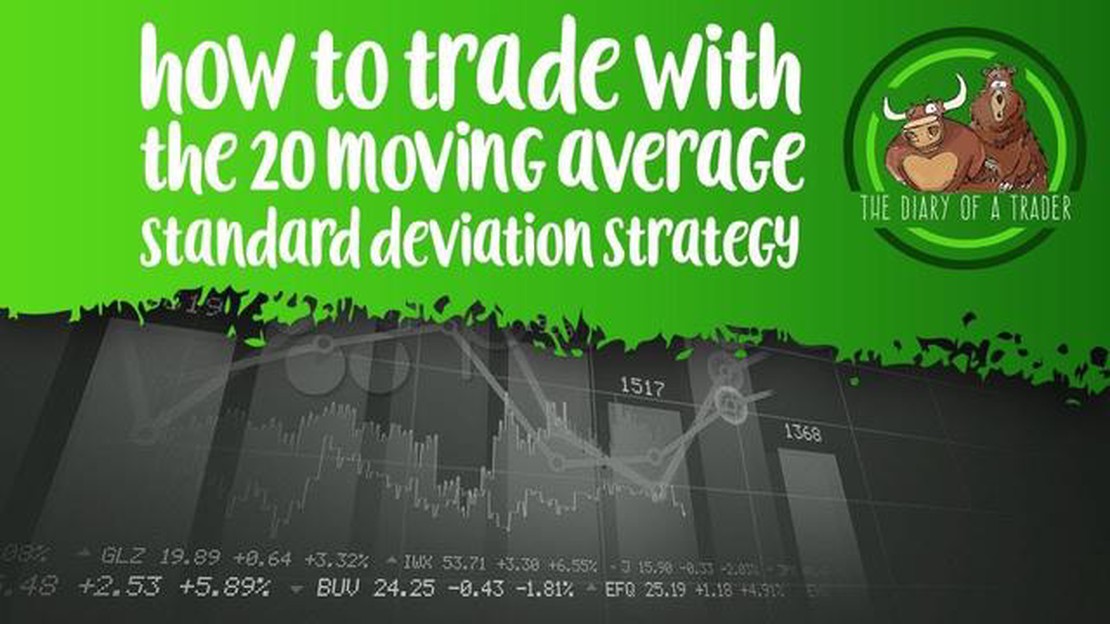
Understanding the Moving Average Standard Deviation The moving average standard deviation is a statistical measure that is commonly used in financial …
Read Article


